2012
European Space Industry Workforce by Country 2000 – 2020
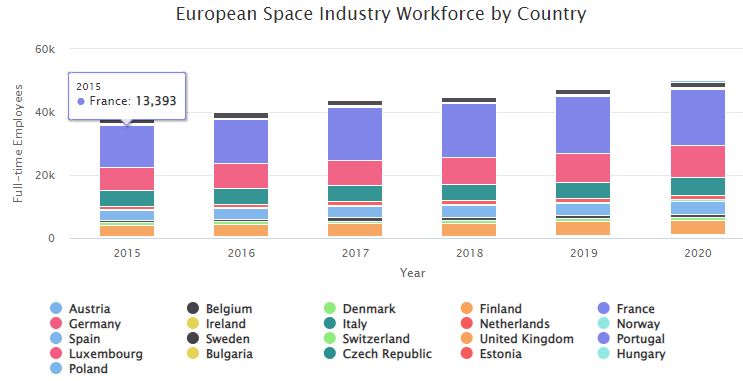
Stacked bar chart showing a twenty-year look at the European space industry workforce by country 2000 – 2020
NASA Civil Servant Workforce 2008-2017

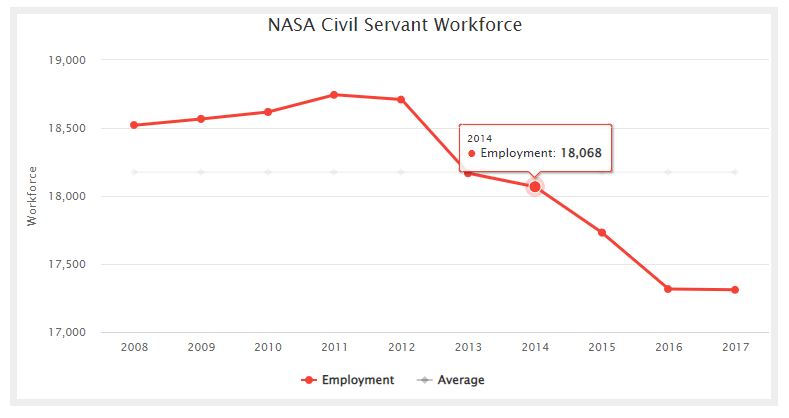
NASA Civil Servant Workforce chart showing the average and actual employment for the years 2008 through 2017.
Workforce: Workforce and Education – TSR 2013
Perspective – TSR 2013
Space Products and Services – TSR 2013
2012- Workforce
Trends in the global space workforce continue to be mixed, with the U.S. space workforce contracting for the sixth year in a row while space workforces in Japan and Europe saw further increases. The global space workforce includes hundreds of thousands of highly skilled individuals, often wit… Thank you for visiting The Space Report! The…
2012 – Doctoral Degrees Awarded
Considering the number of doctoral degrees earned in science and engineering, the European Union has the greatest proportion.
2012 – Positioning, Navigation, and Timing Systems
Note: This exhibit is from The Space Report 2013. Please refer to this year’s exhibits for the most current data as numbers may have been revised since this edition was published.
2012 – Emerging Technologies
While space has many practical applications that are already making real differences in people’s daily lives, many more research activities are still in the early stages of development. Depending on their maturity and complexity, the practical uses of these research avenues are not always well understood or guaranteed.
2012 – Space Products and Services Overview
Products and services derived from or enabled by space assets, technologies, or activities provide tangible benefits to people on Earth and continue to improve the quality of life in countries around the world, often in ways that are not readily apparent.