Interactive Tables and Charts
Data Economy
FCC satellite fees, 2022-2024
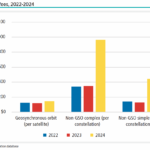
Almost all satellite operators will see much bigger bills this fall from a federal agency that regulates the use of radio frequencies. The U.S. Federal Communications Commission announced in September that satellite operators will face fee hikes up to 270%
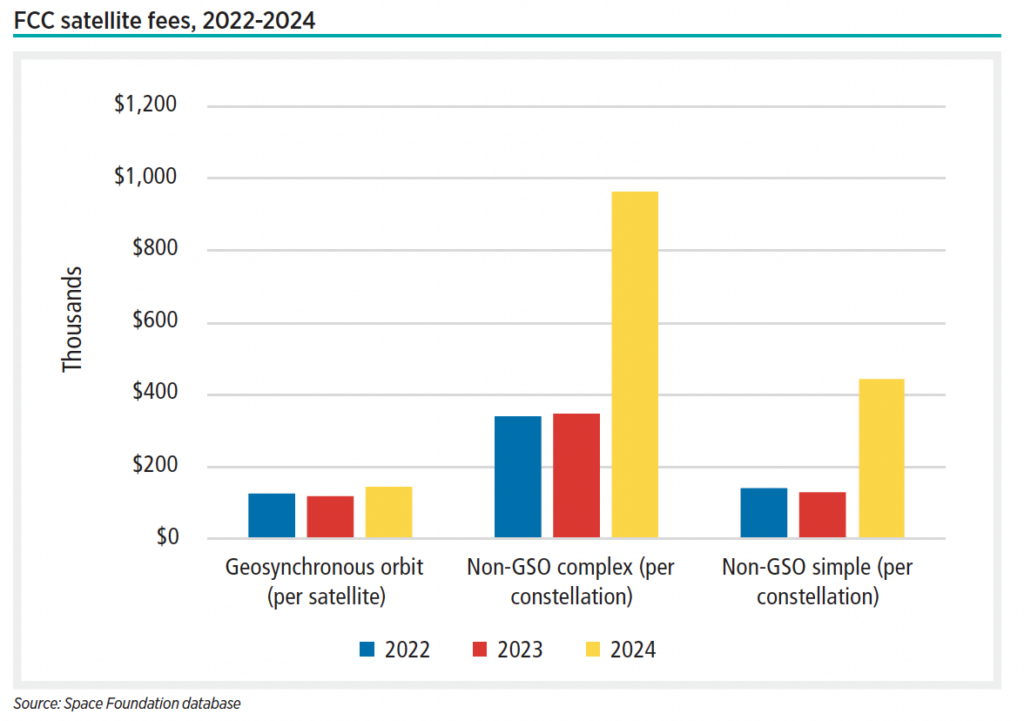
Satellite and space M&A transactions, Q4 2021-Q3 2024
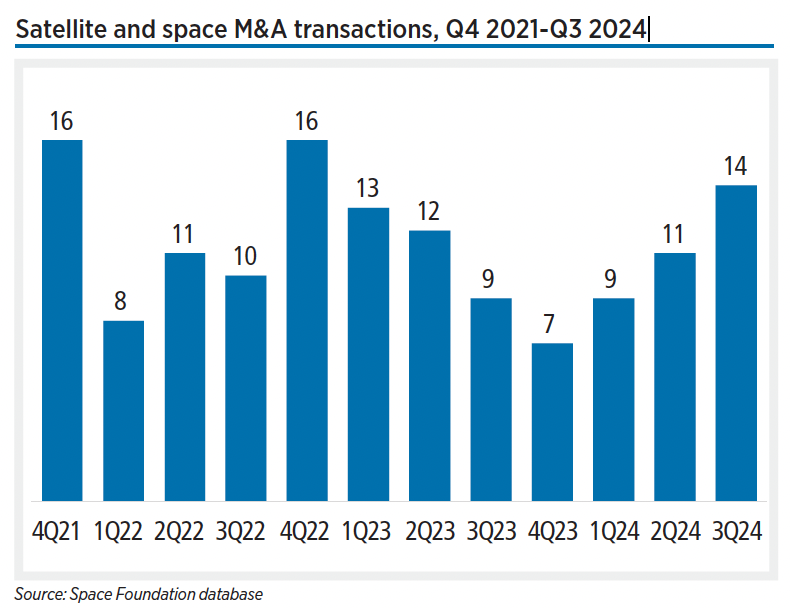
Space sector M&A activity was up in Q3, with 14 announced transactions versus 11 during Q2 and nine in Q1. The transaction volume is the highest of the past seven financial quarters, and comes close to peak activity in Q4 2021 and Q4 2022.
Norway government space spending, 2020-2024
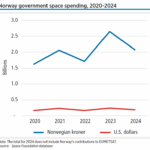
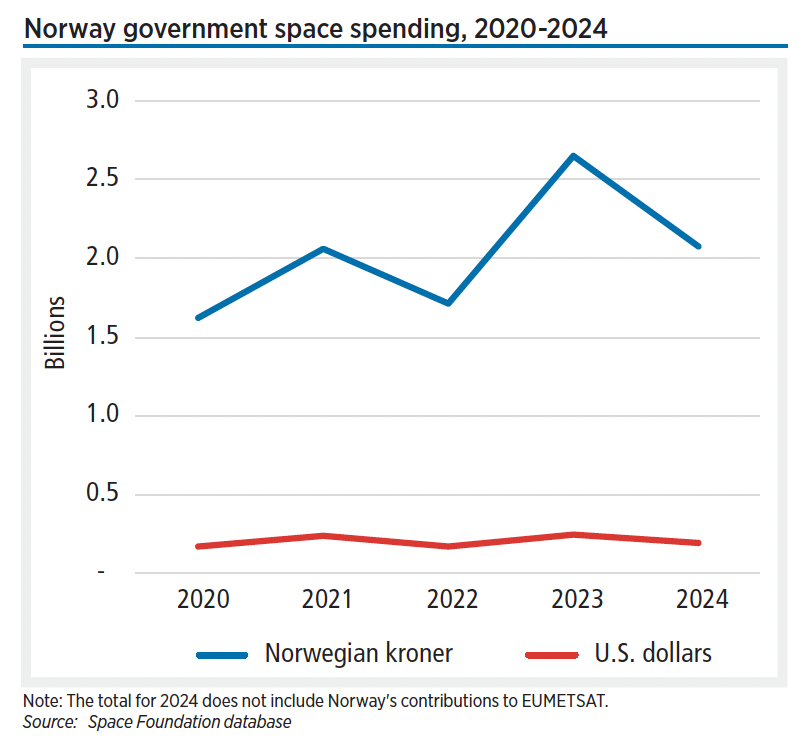
Norway’s history of collaboration with international organizations and industry gives the nation a strong position in the space industry. The Norwegian Space Agency estimates that the country’s space activity totals US$1.1 billion annually.
NASA spending by category, 2023-2025
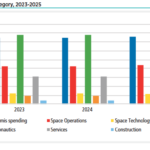
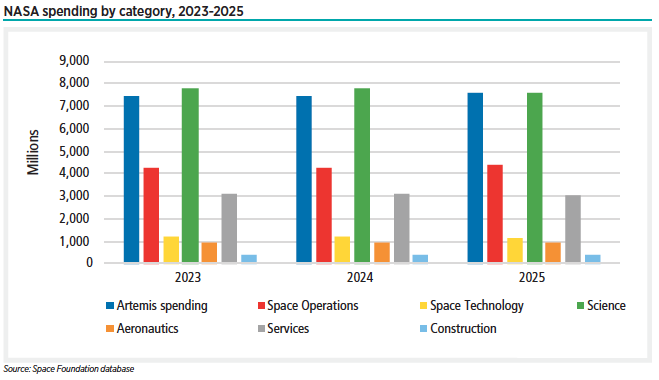
NASA’s plan would raise Artemis spending by $350 million in 2025 to $7.8 billion, while cutting $230 million from the agency’s Science Mission Directorate.
NASA spending, planned vs. actual, in 2022 dollars
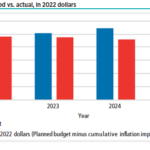
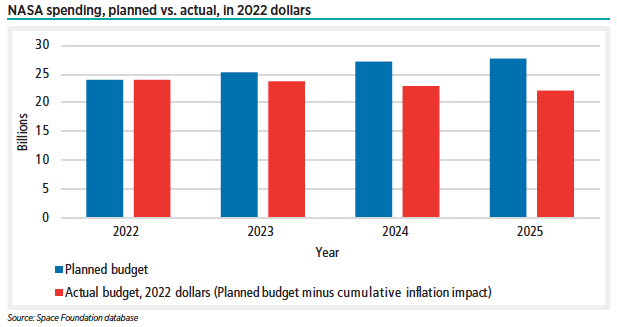
Faced with a budget capped at 2023 levels, NASA is striving to save its lunar ambitions, laying off employees and cutting programs in favor of the Moon.
Satellite and space M&A transactions, Q4 2021-Q2 2024
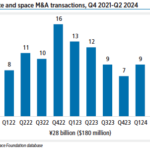
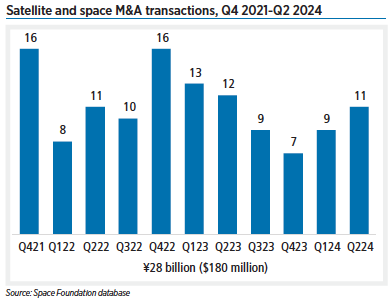
Space sector merger and acquisition activity was up, with 11 announced transactions during Q2 versus nine during Q1 and seven in the final quarter of 2023.
Private investments in space ventures in Europe, average between ESPI and dealroom values
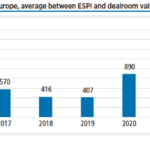
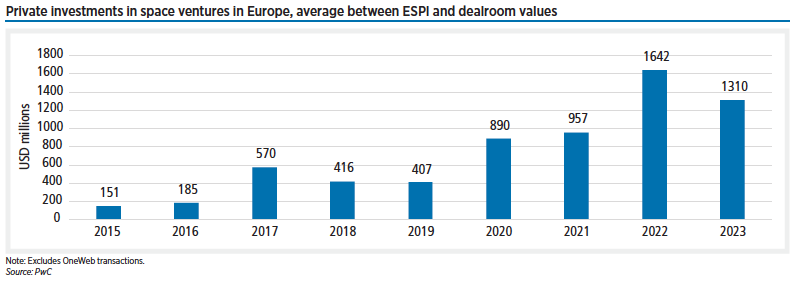
While space remains institutionally driven for most of its segments, the role of private investors in Europe is of growing importance.
Estimated spending for NASA and U.S. defense, 2005-2025
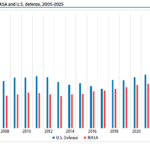
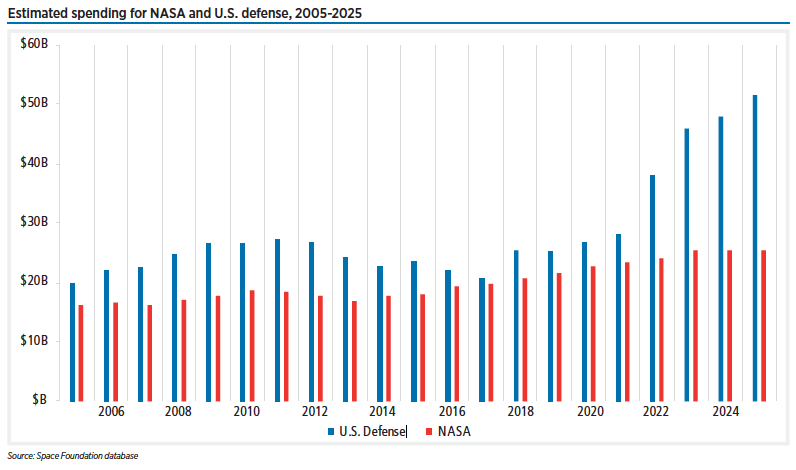
The Pentagon made up more than a third of global defense spending, with $851 billion in 2024, including a record $30 billion for the Space Force.
Space Force, NASA spending, 2020-2025
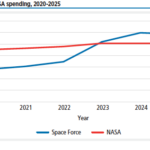
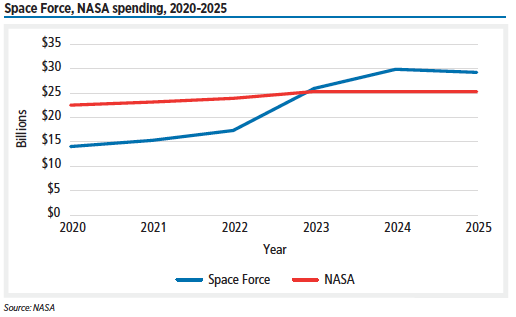
With record 2023 Pentagon space budgets, including $30 billion for the Space Force, the United States remained the globe’s top military spender, topping the combined total of the next nine nations.
Non-NASA U.S. civil space spending by agency, 2022-2025
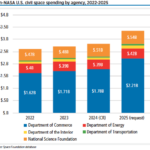
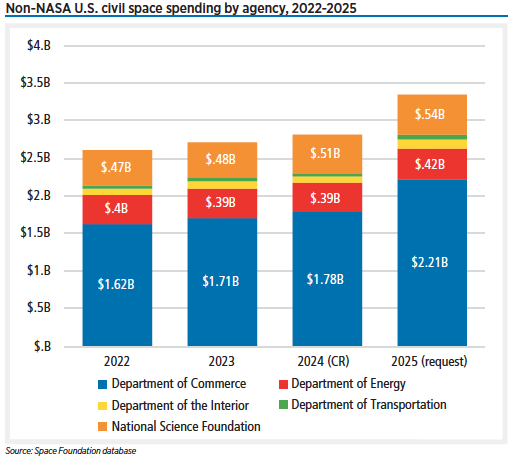
U.S. civil space spending totaled $28 billion in 2023, 5.4% higher than 2022. NASA’s budget is the majority (90%) of this spending. The Department of Commerce has the next highest spending with $1.7 billion, followed by the National Science Foundation ($482 million) and the Department of Energy ($388 million).