Interactive Tables and Charts
Data Investment
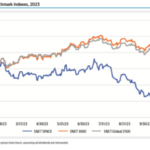
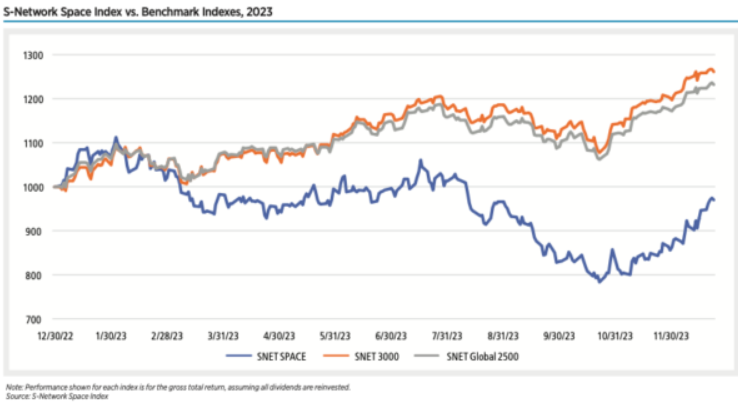
S-Network Space Index vs. Benchmark Indexes, 2023
The space industry is a global one, and the composition of the S-Network Space Index reflects this diversity. Companies listed on U.S. exchanges tend to dominate due to the larger number of companies that meet the financial requirements for inclusion in the index.
S-Network Space Index vs. Benchmark Indexes, H2 2023
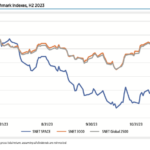
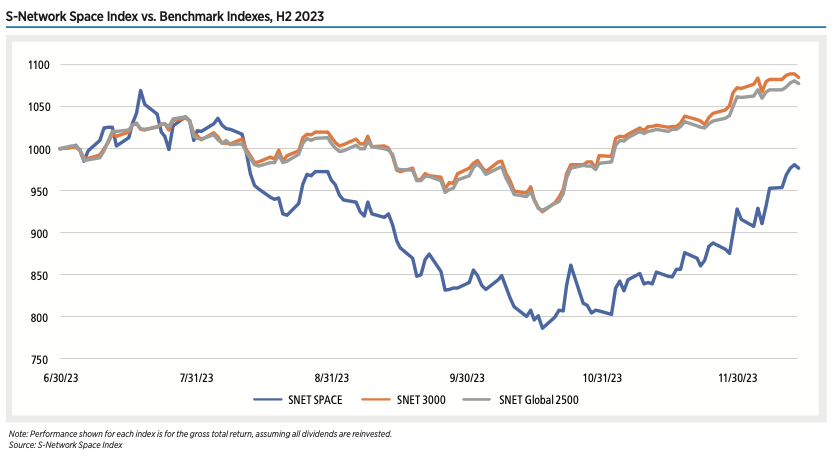
The majority of SNET SPACE’s underperformance was driven by a steep decline of 12.4% in Q3, compared with declines of just over 3% for the other two indexes. In Q4, even though SNET SPACE gained 11.5% and slightly outperformed the SNET Global 2500, this was only sufficient to bring SPACE close to breaking even for the year.
Index Weight by Listing Country as of Dec. 16, 2022
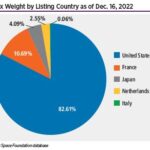
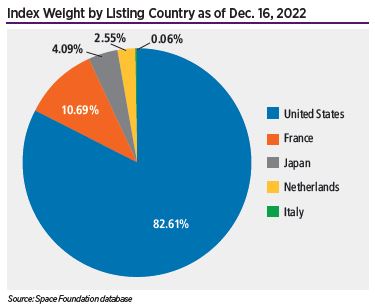
As of December, U.S.-listed companies comprised 82.61% of the weight of the overall index, with France in second place at 10.69%, Japan at 4.09%, the Netherlands at 2.55%, and Italy at 0.06%. Canada was no longer represented due to the removal of MDA, and Italy’s share dropped by a factor of 10 due to the removal of Avio.
S-Network Space Index vs. Benchmark Indexes, 2022
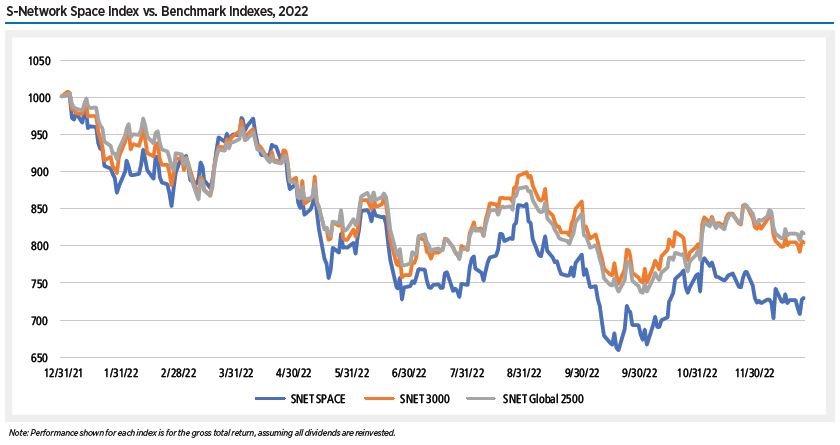
Assessing the performance of the S-Network Space Index for the entirety of 2022, poor performance during the first half of the year resulted in overall losses of 26.8%. This compares with annual declines of 19.5% for the SNET 3000 and 18.3% for the SNET Global 2500, which had a slightly better first half of the year.
S-Network Space Index vs. Benchmark Indexes, H2 2022
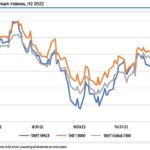
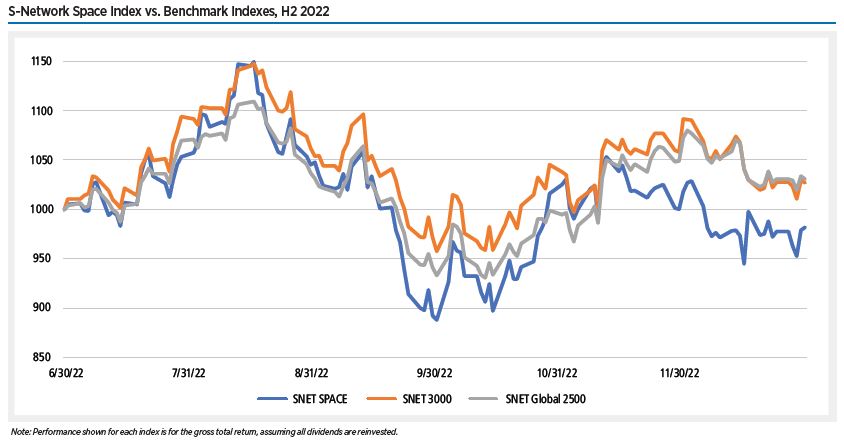
In the second half of 2022, the S-Network Space Index (SNET SPACE) underperformed other benchmark indexes, declining 1.7%. This compares to a 0.3% increase for the S-Network U.S.
S-Network Space Index vs. Benchmark Indexes, 2021
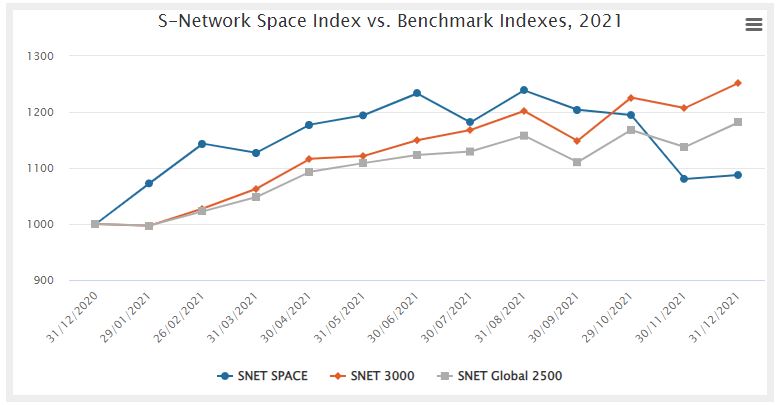
During the global pandemic recovery, stocks for space-related companies recovered at a quicker rate than traditional stocks, as shown in this S-Network Space Index analysis.
S-Network Space Index vs. Benchmark Indexes, Q4 2021
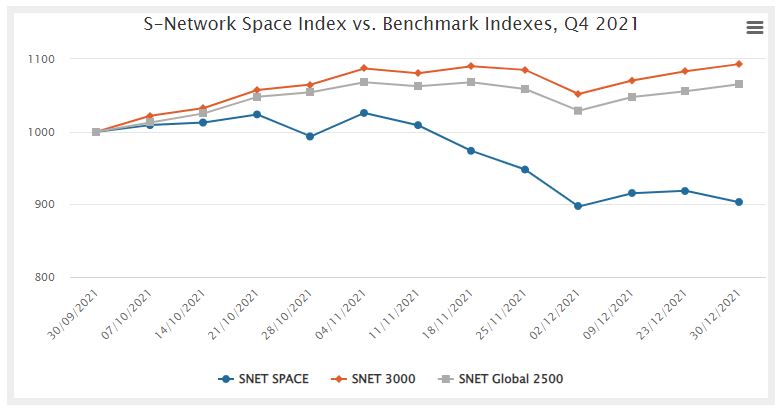
In the fourth quarter of 2021, selected space-related stocks that were included in the S-Network Space Index for analysis did not perform as well as benchmark indexes.
Top 10 Equity Financings, 2018-YTD 2021
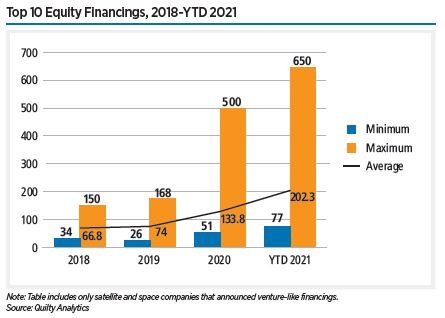
In less than four years, the value of equity financing behind space-related investment increased more than fourfold.
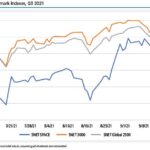
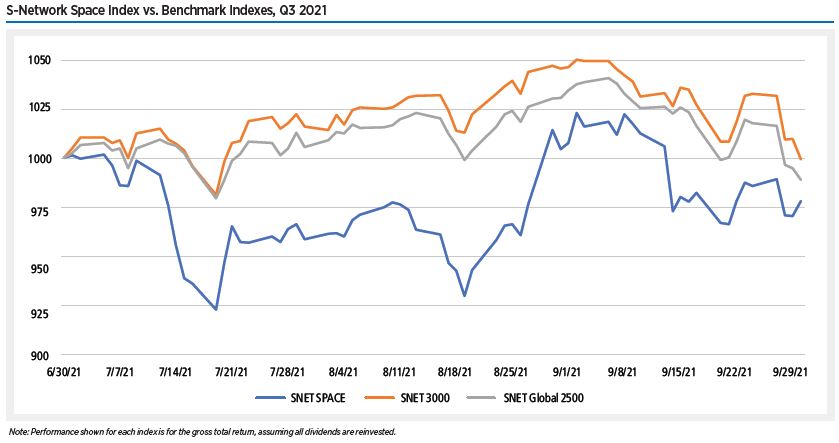
S-Network Space Index vs. Benchmark Indexes, Q3 2021
S-Network Space Index Weight by Listing Country as of Sept. 30, 2021
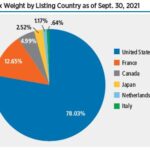
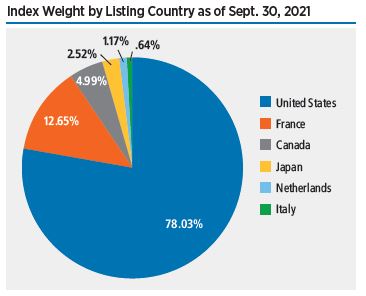
This chart shows how space companies included in the S-Network Space Index in Q3 2021 are represented by nation.