Interactive Tables and Charts
Data Infrastructure
Successful Orbital Launches, 1957-2021
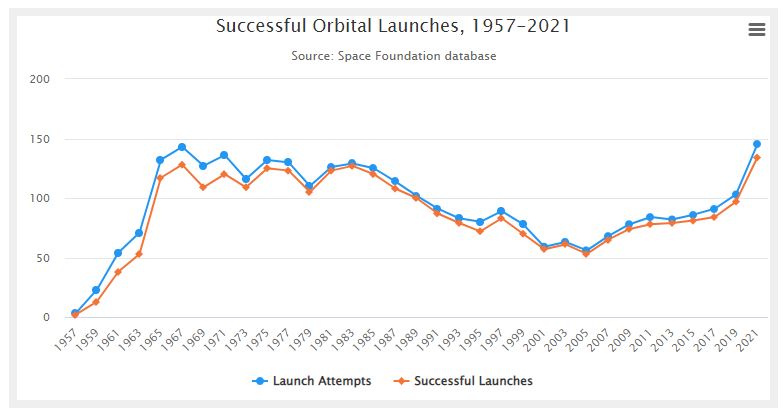
From the days of Sputnik to SpaceX, this chart tracks launch attempts and successful launches.
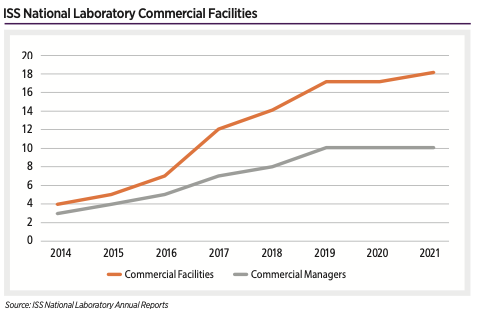
ISS National Laboratory Commercial Facilities
This fully interactive chart shows changes made in the accompanying table. Use the tools just above the table for sorting, advanced filtering, and other options, which will then be reflected on the live chart. For more data source information click to read the entire resource.
Share of Communications Payloads by Sector, by Year, 2016-2020
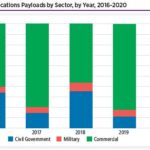
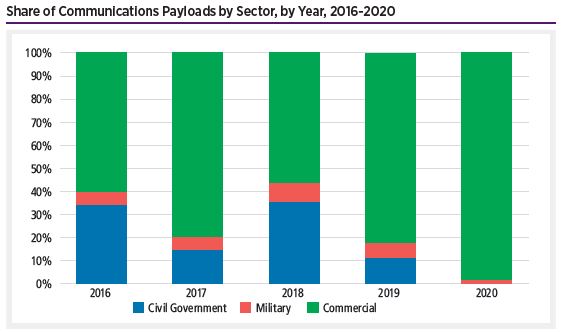 This fully interactive chart shows changes made in the accompanying table. Use the tools just above the table for sorting, advanced filtering, and other options, which will then be reflected…
 Share of Communications Payloads by Orbit, 2016-2020
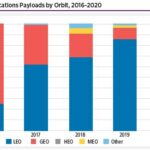
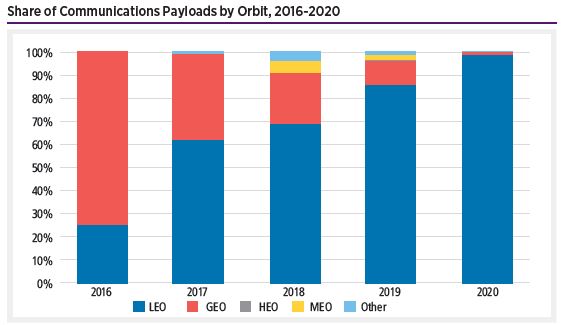 This fully interactive chart shows changes made in the accompanying table. Use the tools just above the table for sorting, advanced filtering, and other options, which will then be reflected…
 Successful First Stage Booster Recovery Mission Share out of Total Missions, 2017-mid-2021
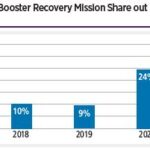
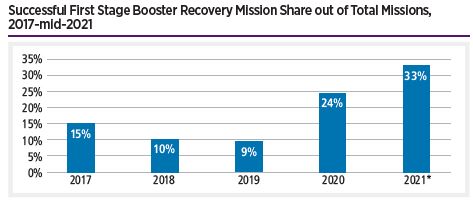 This fully interactive chart shows changes made in the accompanying table. Use the tools just above the table for sorting, advanced filtering, and other options, which will then be reflected…
 Orbital Launch Attempts by Share by Sector, 2017-mid-2021
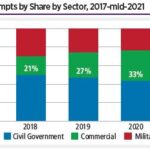
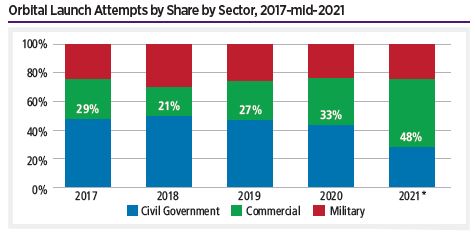 This fully interactive chart shows changes made in the accompanying table. Use the tools just above the table for sorting, advanced filtering, and other options, which will then be reflected…
 Orbital Launch Attempts by Half-Year, 2017-mid-2021
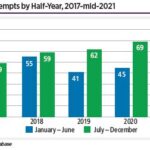
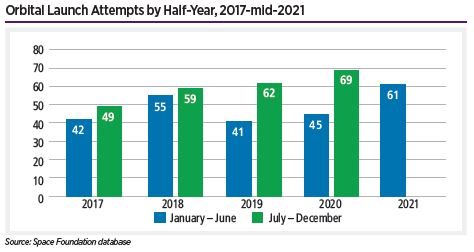 This fully interactive chart shows changes made in the accompanying table. Use the tools just above the table for sorting, advanced filtering, and other options, which will then be reflected…
 Average Payloads Deployed per Successful Orbital Launch (2011-2020)
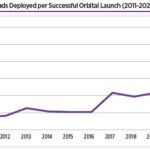
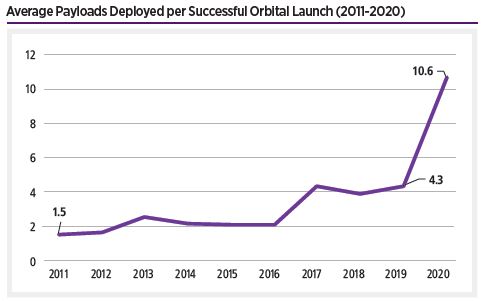
Why might we be seeing this shift towards small vehicles? Average payload deployment per successful launch, a reflection of growing ridesharing among spacecraft operators, reached a height of nearly 11 payloads per launch in 2020. This figure is 2.5 times higher than the previous year and 7 times higher than a decade ago.
Launch Log, 2021


Interested in global space launch vehicle satellite activity? Please select the associated link to read about it. Launch data is updated every day during weekdays, excluding U.S. holidays.
Launch Log, 2020

Interested in global space launch vehicle satellite activity? Please select the associated link to read about it. Launch data is updated every day during weekdays, excluding U.S. holidays.