Interactive Tables and Charts
Data Workforce
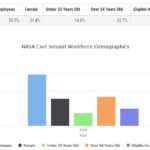
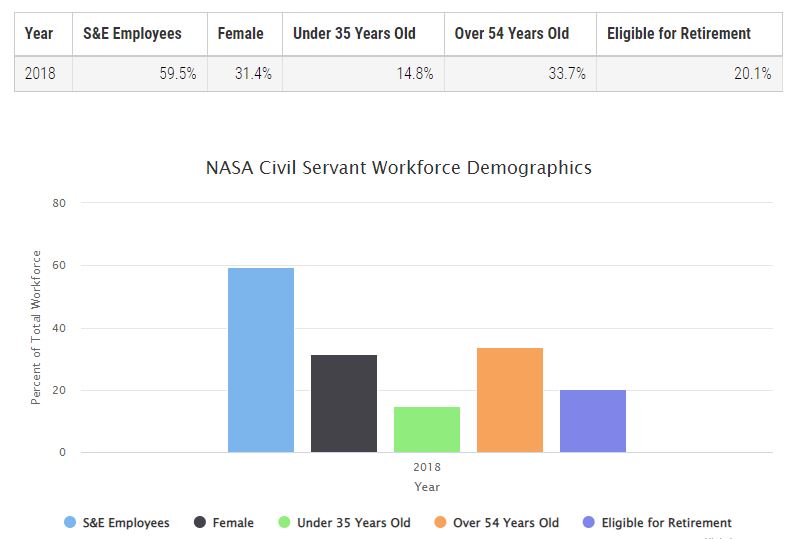
2018 – NASA Civil Servant Workforce Demographics
European Space Industry Workforce by Country 2000 – 2020
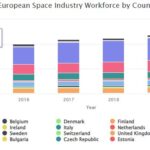
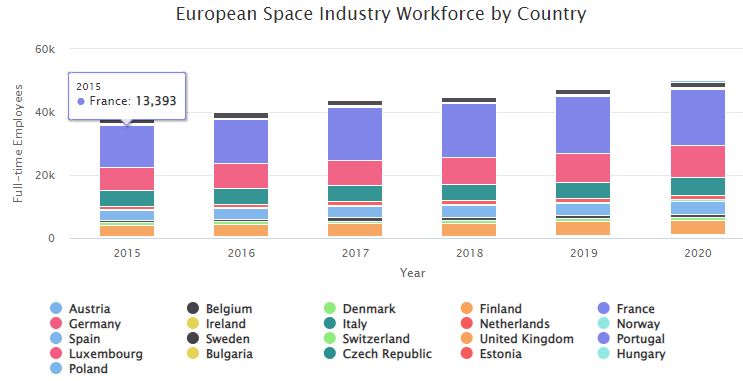
Stacked bar chart showing a twenty-year look at the European space industry workforce by country 2000 – 2020
NASA Civil Servant Workforce 2008-2017

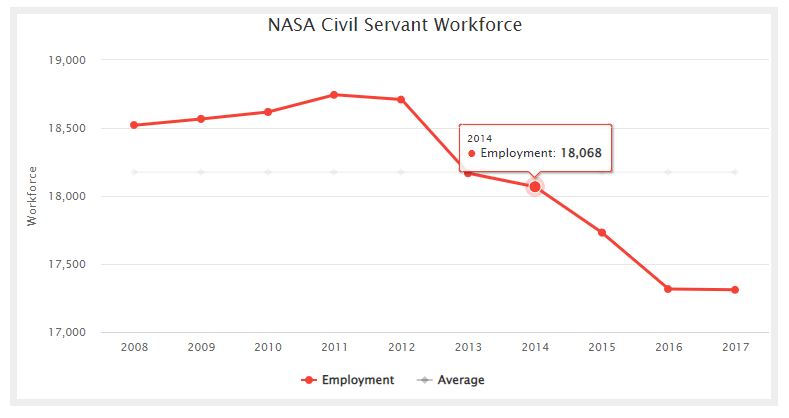
NASA Civil Servant Workforce chart showing the average and actual employment for the years 2008 through 2017.
- « Previous
- 1
- …
- 4
- 5
- 6