Interactive Tables and Charts
Data Economy
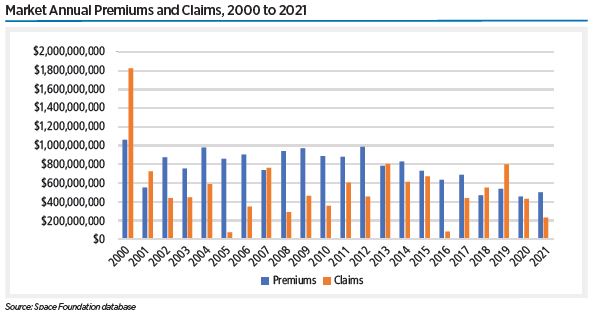
Market Annual Premiums and Claims, 2000 to 2021
KARI Annual Expenditure (millions USD), 2010-2020
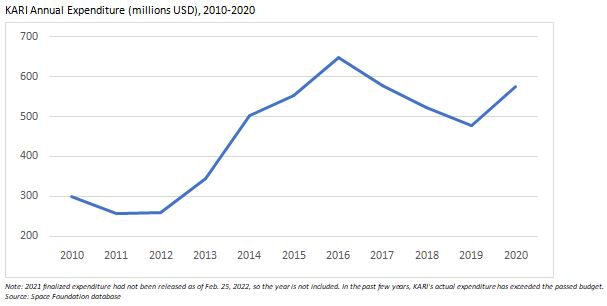
South Korea is intent on building its space program, as this look at its national space agency budget reflects.
Index Weight by Listing Country as of Dec. 17, 2021
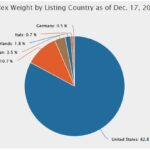
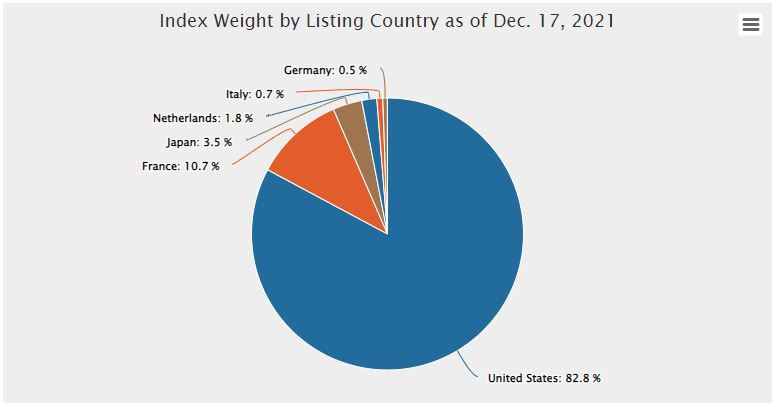
Companies included in the S-Network Space Index in the fourth-quarter 2021 analysis are shown here by national affiliation.
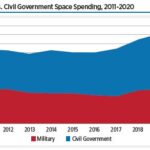
Share of U.S. Government Space Spending in Military and Civil Government Domains, 2011-2020
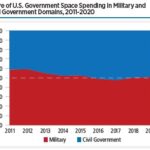
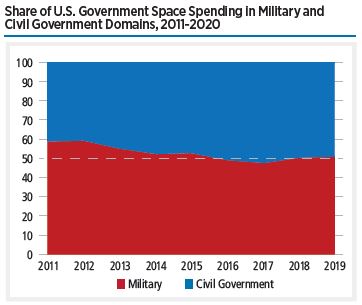
Share of U.S. Government space spending in military and civil government domains, 2011-2020
Share of National Aeronautics and Space Administration (NASA) Budget by Budgetary Authority, 2020
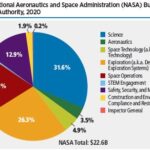
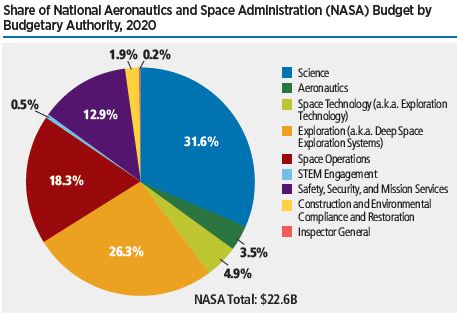
Almost 44% of all U.S. space spending was allocated to NASA in 2020 — over $22.6 billion.184 This figure is a 5.3% increase over 2019 and a 22.8% increase over the preceding decade. The largest share of this budget, 31.6%, was allocated to the Science Program, which expanded in 2020 to include Biological and Physical Sciences for the first time.
Rate of Change in U.S. Government Space Spending, 2011-2020
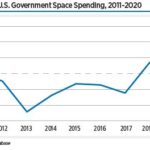
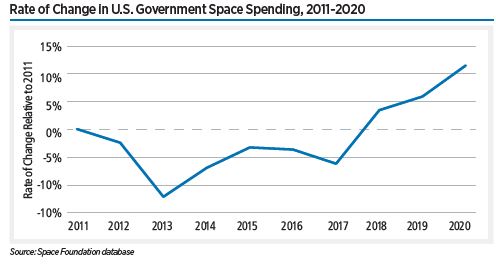
Almost 44% of all U.S. space spending was allocated to NASA in 2020 — over $22.6 billion.184 This figure is a 5.3% increase over 2019 and a 22.8% increase over the preceding decade.
Global Military vs. Civil Government Space Spending, 2011-2020
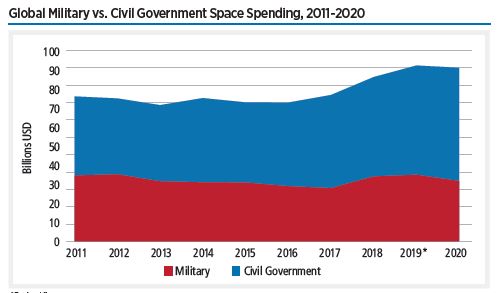
Notably, military space spending in 2020, estimated at US$31.4 billion, constituted the smallest share of global government space spending in a decade – only 35%. This figure marks a reduction from 2019, wherein the $34.6 billion spent globally constituted 38% of government space spending. U.S. military space spending increased by 6.1% in 2020, reaching a new height of $26.6 billion and comprising more than 80% of global military space spending for the first time since 2011.
Rate of Change in Non-U.S. Government Space Spending, 2011-2020
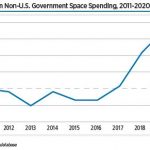
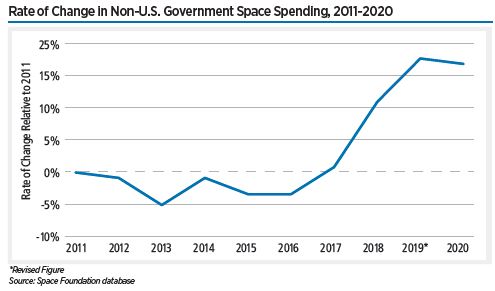
Non-U.S. military space was funded at less than half the level it had been in 2019, according to a country-level analysis of six nations spread across four continents: Argentina, Brazil, France, Germany, Japan, and Nigeria. This drop in investment suggests that, for many countries, military space takes a back seat to civil space ambitions and emergency relief for terrestrial disasters such as the coronavirus for many countries.
JAXA Budget 2004-2021
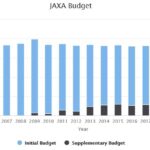
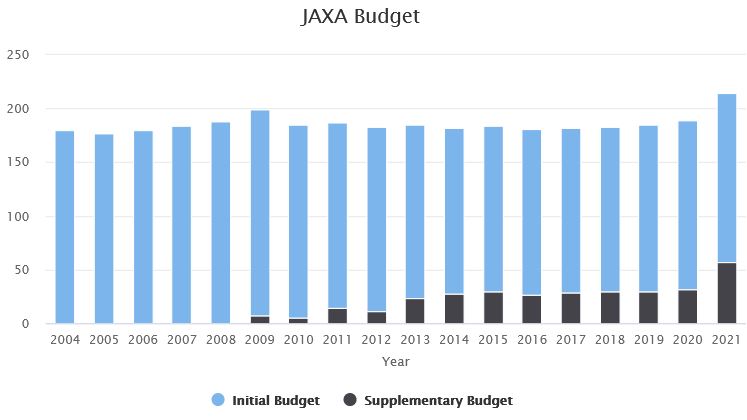
An annual budget for the Japan Aerospace Exploration Agency (JAXA). This chart spans 2004 through 2021 including the initial budget as well as the supplemental budget.
Earth Observation Revenue Estimates – a three-year look 2015, 2016, 2017
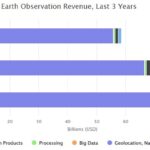
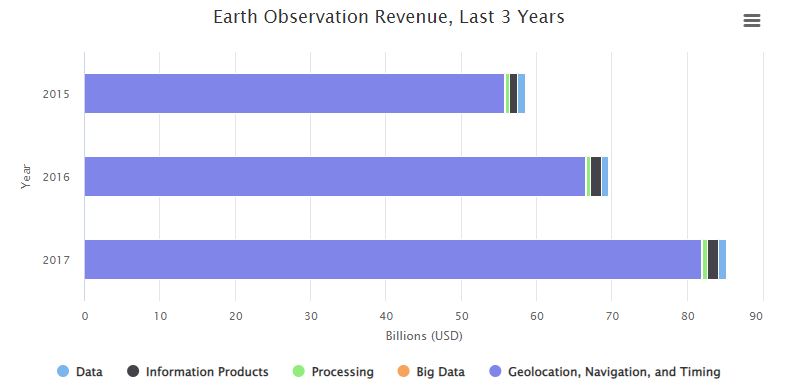
Earth observation revenue estimates, a three-year look including 2015, 2016, and 2017. Revenue estimates for data, big data, information products, and others.