Interactive Tables and Charts
Data Workforce
NASA Civil Servant Workforce Age Profiles Over Time 1997-2022
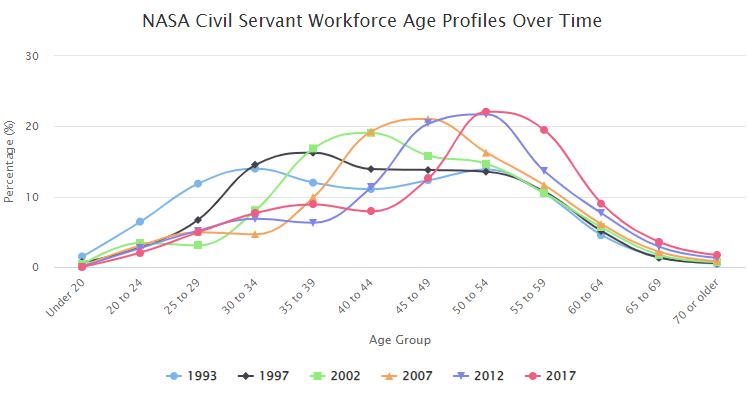
As of January 2022, NASA’s workforce included 17,841 people, approximately the same as at the beginning of fiscal year (FY) 2021. Most of the workforce – 64.9% – is made up of science and engineering employees. . .
NASA Civil Servant Workforce, 2012-2022
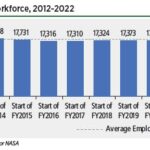
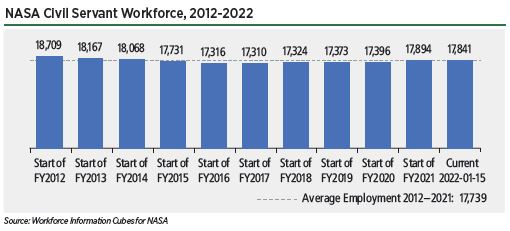
NASA’s civil service workforce has grown gradually in recent years, contributing to an increase in U.S. space employment.
U.S. Space Industry Core Employment, 2011-2021
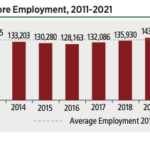
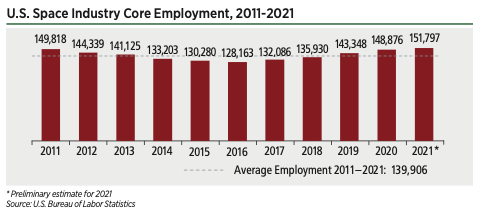
Core employment in 5 key space sectors continued to grow in 2021. These employment levels do not reflect all employment in the U.S. space industry, but rather, track employment in key sectors most closely associated with U.S. space employment.
U.S. Employment and Space-Related Employment, Jan. 2020-July 2021
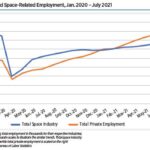
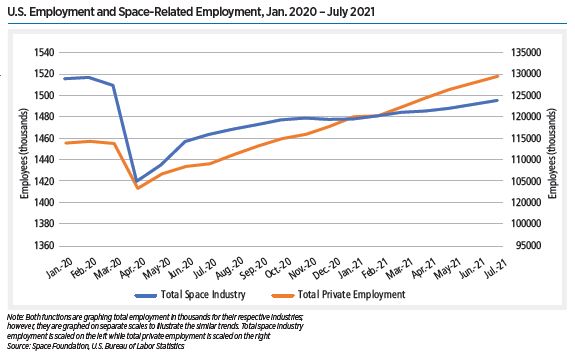
According to data from the U.S. Bureau of Labor Statistics (BLS), the space industry also had a slower initial recovery than total employment (0.96% compared to 3.1% in May 2020) before maintaining growth at a near constant rate since July 2020.
Indian Department of Space Employment, 2011-2020
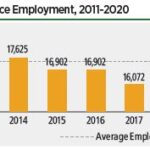
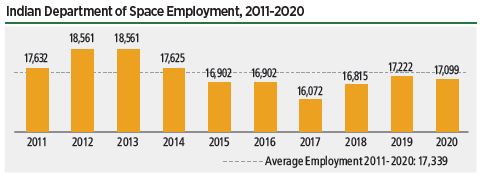
A large proportion of the workforce — 76% — is made up of technical employees. In 2020, women made up 19.5% of the space workforce and 16.1% of the technical workforce.
JAXA Workforce, 2010-2020
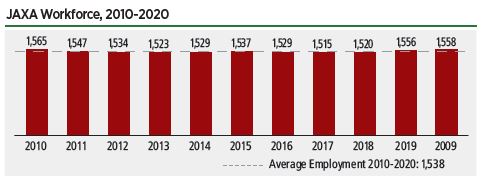
The Japan Aerospace Exploration Agency (JAXA) employed 1,558 people in 2020, approximately the same number as in 2019. Engineers and researchers account for 70.1% of this total.
European Space Industry Employment, 2010-2020
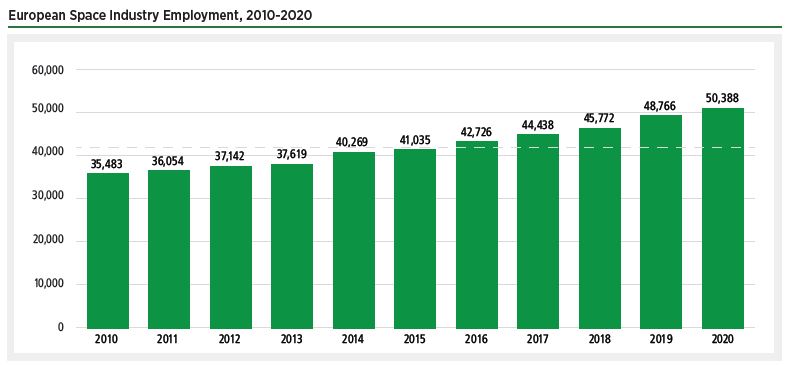
The European space workforce included 50,388 workers in 2020, an increase of 3.3% from the 48,766 workers in 2019. The largest increases were seen in . . .
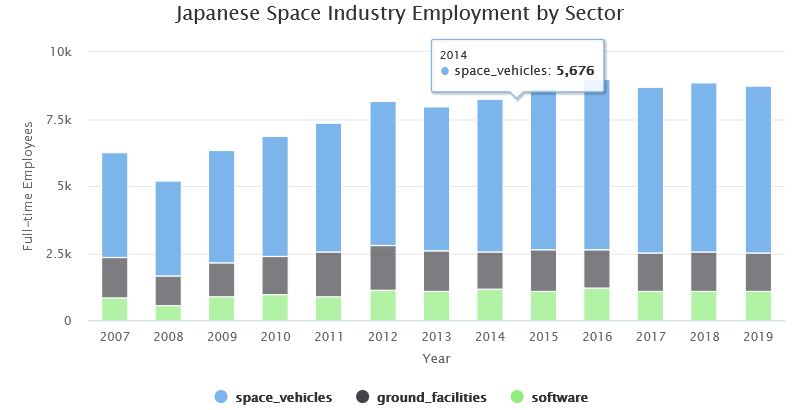
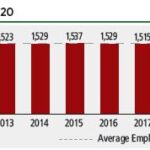
Japanese Space Industry Employment, 2009-2019
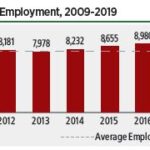
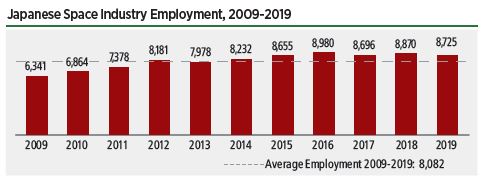
According to the Society of Japanese Aerospace Companies, the Japanese space workforce included 8,725 workers in 2019. . . More than 70% of these workers are in the space vehicle sector. While this sector decreased 1.9% from 2018 to 2019, it remains nearly 10% larger than it was five years ago.
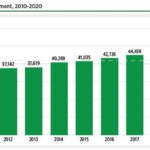
U.S. Space Industry Core Employment, 2010-2020
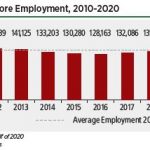
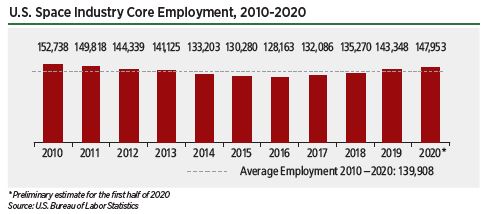
The industry has been growing steadily since 2016, with employment increasing 15.4% over the last four years. These preliminary results suggest that the space industry has been relatively resilient to the effects of the global pandemic.