Interactive Tables and Charts
Data Workforce
Representation of Women and Minorities among Senior Officials and Management Compared to Representation in U.S. Workforce
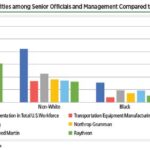
Four of the largest aerospace contractors — Lockheed Martin, Northrop Grumman, Boeing, and Raytheon — make their EEO-1 reports public. Within these companies, the proportion of females and minorities is similar to that seen in the transportation manufacturing sector overall. However, they have significantly fewer Black employees than that sector, on average.
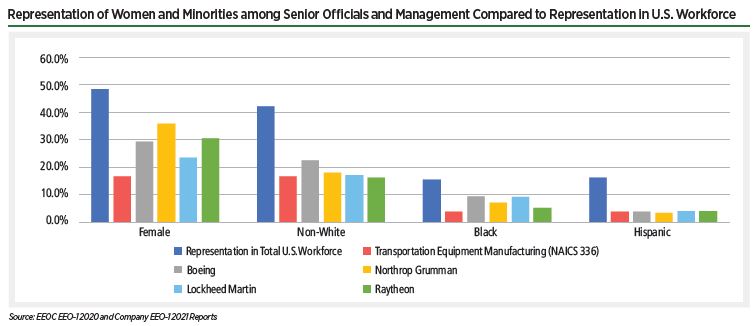
Foreign-Born Individuals in S&E Occupations in The United States, By Level Of Degree and Occupation: 2017
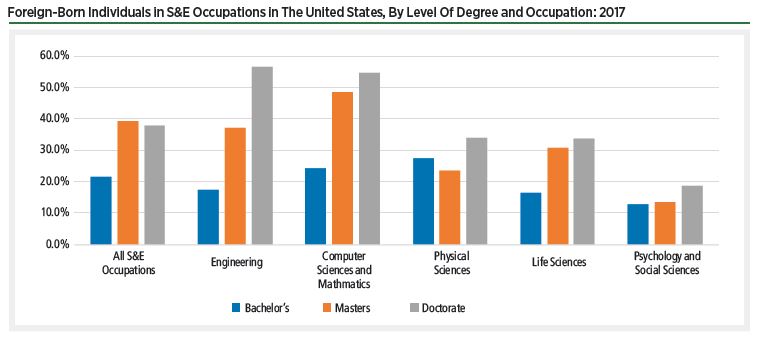
The National Science Foundation in 2020 found that many firms covered shortfalls in science and engineering workers by courting immigrants. More than a third of workers holding doctorate degrees in science and engineering jobs across America were born in another country.
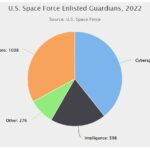
U.S. Aerospace Engineers by Age
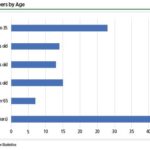
In addition to the current openings, the U.S. Bureau of Labor Statistics expects the need for aerospace engineers possessing at least a bachelor’s degree to grow by 6% through 2031.
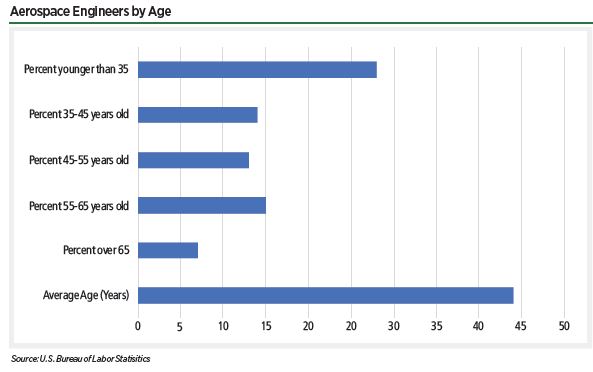
U.S. Space Force Enlisted Guardians, 2022
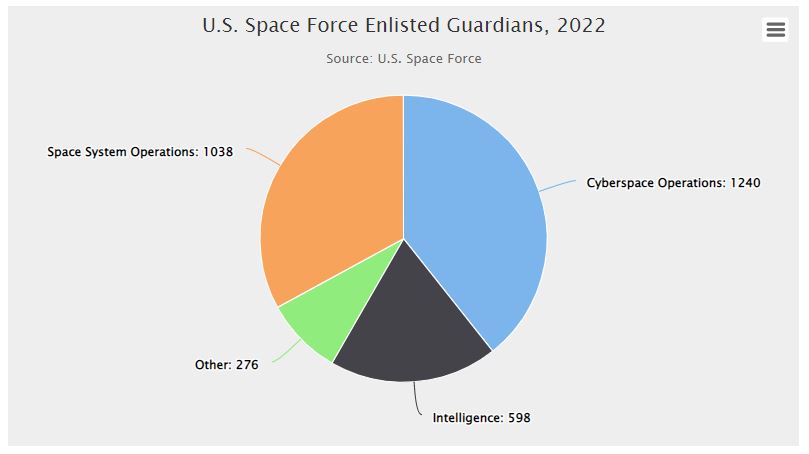
While recruitment has been a challenge across other sections of the military, the Space Force has had more applicants than it could accept. For example, when looking for cyber professionals with private-sector experience, the Space Force received hundreds of applications for six positions.
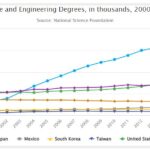
Science and Engineering Degrees, in Thousands, 2000-2016
“Space education, research, and workforce development in the public and private sectors are core components of the U.S. national interest, with the potential to drive exploration and scientific discovery, to find new solutions for pressing challenges, including climate change, to strengthen American national security, and to provide good-paying jobs for Americans,” the roadmap document states.
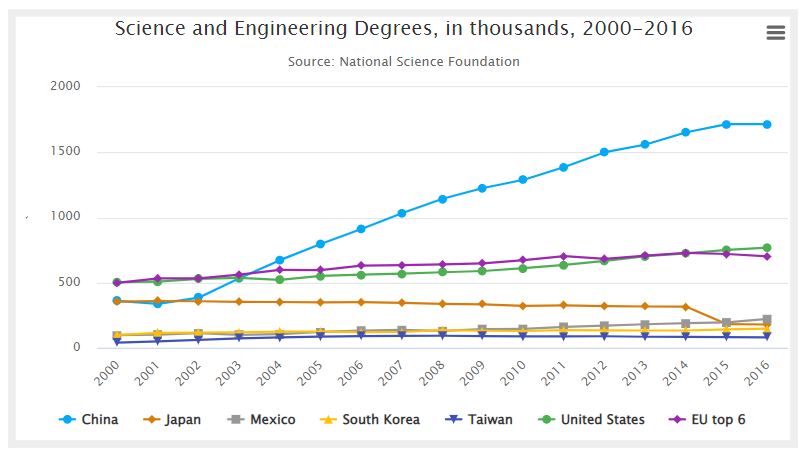
U.S. Military Space Spending 2005-2022
Gallagher said the military must accelerate its efforts in space and cyberspace to keep pace with Russia and China, improving Pentagon cybersecurity and redesigning Space Force satellites to harden constellations against attack.
U.S. Space Force Officers, 2022
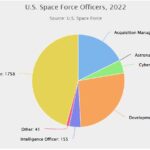
Over the course of 2022, the Space Force continued to grow through the transfer of individuals from other branches of the military. In 2022, 243 transfer slots — 29 officer and 214 enlisted — were available.
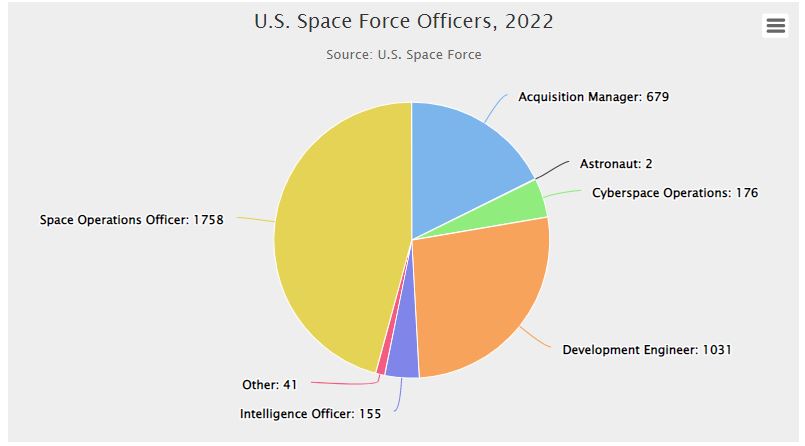
Average Satellite Mass per Payload (kg), 2012-2022

For 2022, spacecraft deployed with a mass of 1,000 kg or less numbered an estimated
2,144. Th ere were 65 spacecraft massing more than 1,000 kg deployed during 2022.16 Despite the increase in large spacecraft
deployments in 2022, their share of overall satellite deployments remained under 3%.
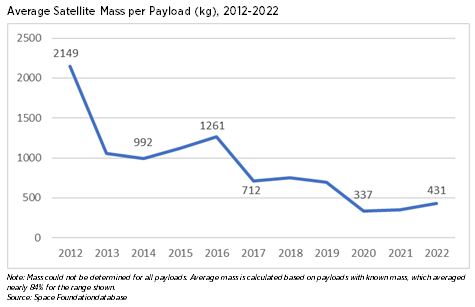
Campaign Spending by Aerospace and Defense PACs by Political Party 2012-2022
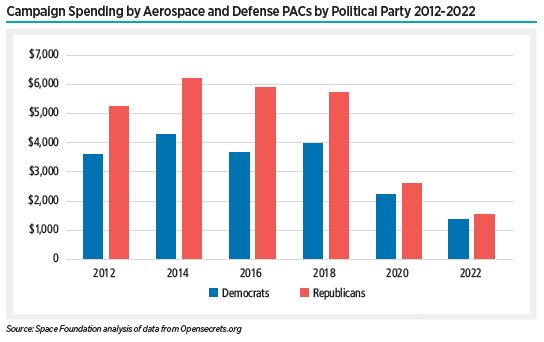
Political action committees (PACs) representing aerospace industry and defense firms weighted their federal campaign donations narrowly toward Republicans during the 2022 campaign cycle.
U.S. 8th Grade Math Scores

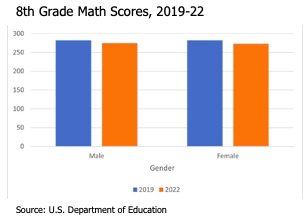
. . . students who struggle in high school math and science classes won’t cut it in college engineering classes unless higher education institutions invest heavily in remedial education to build skills students should have mastered in high school.