Interactive Tables and Charts
S-Network Space Index vs. Benchmark Indexes, Q2 2021
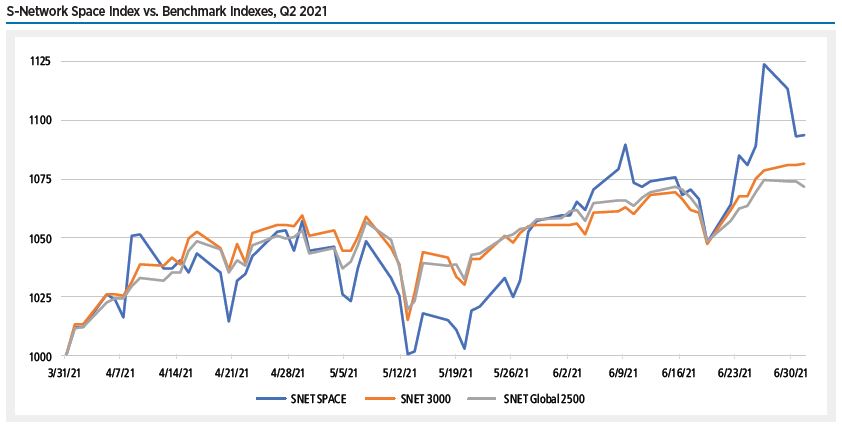
In the second quarter of 2021, the S-Network Space Index (SNET SPACE) outperformed other benchmark indexes, gaining 9.4%. This compares to an 8.2% increase for the S-Network U.S. Equity 3000 Index (SNET 3000), which tracks the 3,000 largest (by market capitalization) U.S. stocks.
Share of U.S. Government Space Spending in Military and Civil Government Domains, 2011-2020
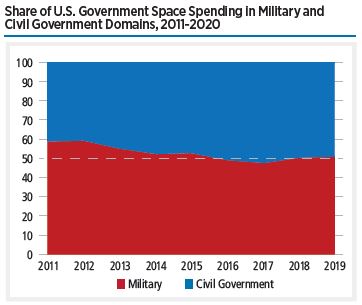
Share of U.S. Government space spending in military and civil government domains, 2011-2020
Share of National Aeronautics and Space Administration (NASA) Budget by Budgetary Authority, 2020
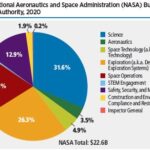
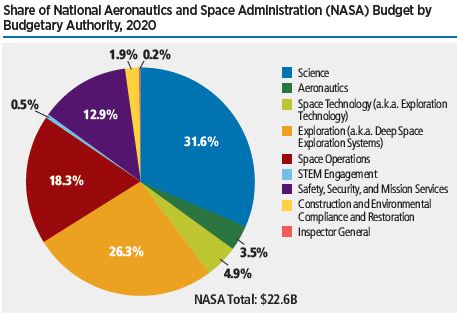
Almost 44% of all U.S. space spending was allocated to NASA in 2020 — over $22.6 billion.184 This figure is a 5.3% increase over 2019 and a 22.8% increase over the preceding decade. The largest share of this budget, 31.6%, was allocated to the Science Program, which expanded in 2020 to include Biological and Physical Sciences for the first time.
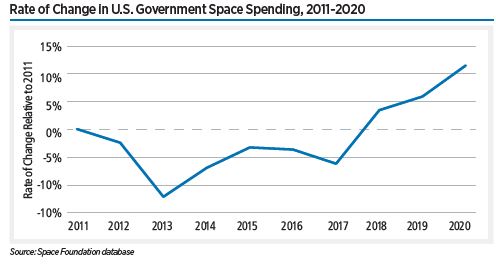
Rate of Change in U.S. Government Space Spending, 2011-2020
Almost 44% of all U.S. space spending was allocated to NASA in 2020 — over $22.6 billion.184 This figure is a 5.3% increase over 2019 and a 22.8% increase over the preceding decade.
Global Military vs. Civil Government Space Spending, 2011-2020
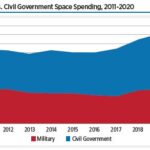
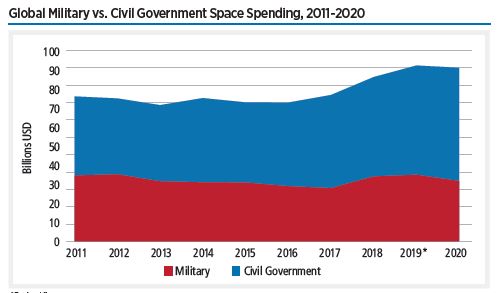
Notably, military space spending in 2020, estimated at US$31.4 billion, constituted the smallest share of global government space spending in a decade – only 35%. This figure marks a reduction from 2019, wherein the $34.6 billion spent globally constituted 38% of government space spending. U.S. military space spending increased by 6.1% in 2020, reaching a new height of $26.6 billion and comprising more than 80% of global military space spending for the first time since 2011.
U.S. Space Industry Core Employment, 2010-2020
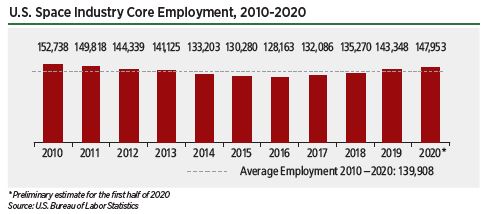
The industry has been growing steadily since 2016, with employment increasing 15.4% over the last four years. These preliminary results suggest that the space industry has been relatively resilient to the effects of the global pandemic.
Rate of Change in Non-U.S. Government Space Spending, 2011-2020
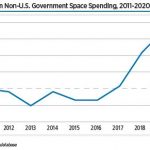
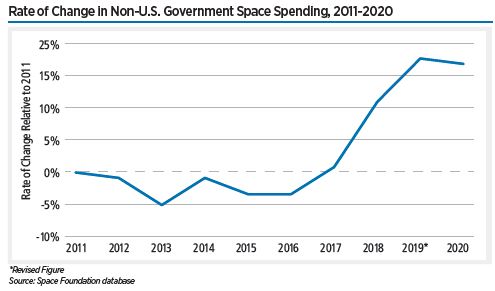
Non-U.S. military space was funded at less than half the level it had been in 2019, according to a country-level analysis of six nations spread across four continents: Argentina, Brazil, France, Germany, Japan, and Nigeria. This drop in investment suggests that, for many countries, military space takes a back seat to civil space ambitions and emergency relief for terrestrial disasters such as the coronavirus for many countries.
Average Payloads Deployed per Successful Orbital Launch (2011-2020)
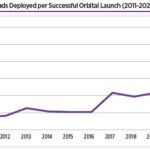
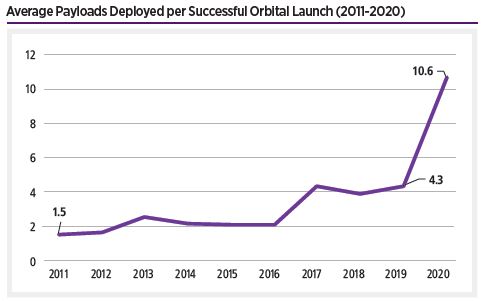
Why might we be seeing this shift towards small vehicles? Average payload deployment per successful launch, a reflection of growing ridesharing among spacecraft operators, reached a height of nearly 11 payloads per launch in 2020. This figure is 2.5 times higher than the previous year and 7 times higher than a decade ago.
S-Network Space Index Weight by Country as of March19, 2021
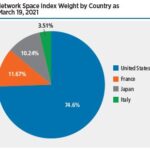
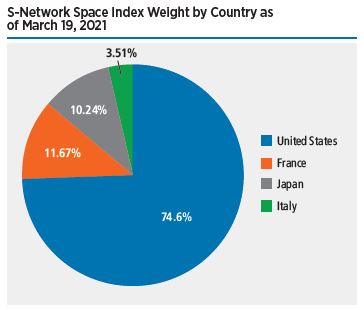
On March19, 2021, the index underwent its quarterly rebalancing to maintain compliance with the index rules—adjusting the relative contributions of each of the constituent companies. In contrast with early 2020, which saw multiple out-of-cycle changes due to company bankruptcies, there were no changes to the constituents, and the index continued to track 31 companies.
S-Network Space Index vs. Benchmark Indexes, May 7, 2018 –March 31, 2021
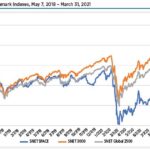
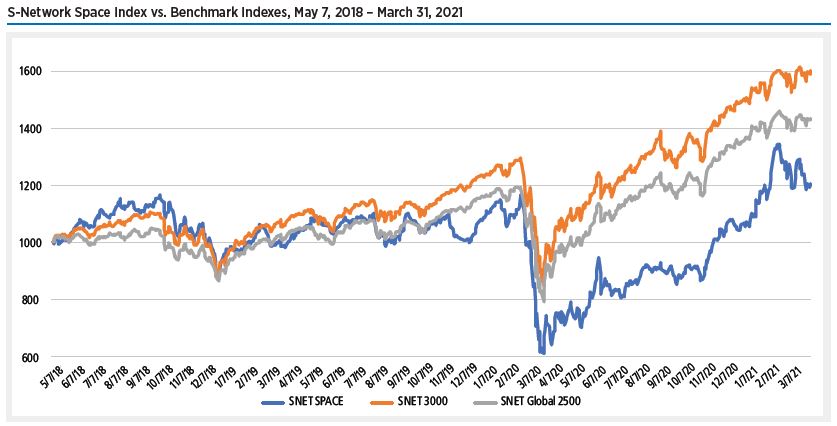
Assessing the multi-year performance of the S-Network Space Index since live calculation began in May 2018, the outperformance in Q1 2021 was insufficient to close the substantial gap the SNET 3000 and SNET Global 2500 opened up in late 2019 and early 2020.