Interactive Tables and Charts
Share of Communications Payloads by Sector, by Year, 2016-2020
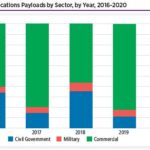
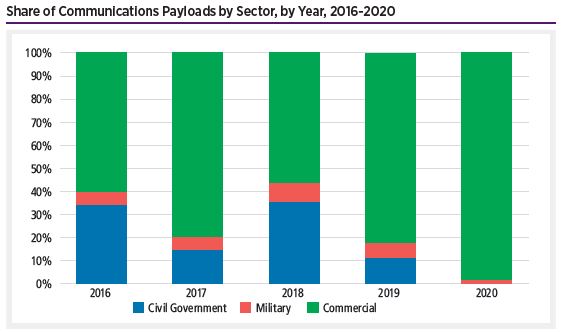 This fully interactive chart shows changes made in the accompanying table. Use the tools just above the table for sorting, advanced filtering, and other options, which will then be reflected…
 Share of Communications Payloads by Orbit, 2016-2020
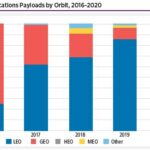
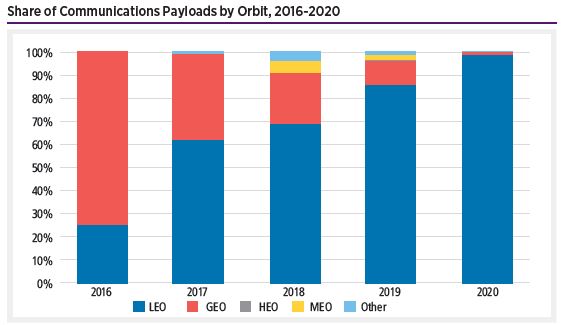 This fully interactive chart shows changes made in the accompanying table. Use the tools just above the table for sorting, advanced filtering, and other options, which will then be reflected…
 Successful First Stage Booster Recovery Mission Share out of Total Missions, 2017-mid-2021
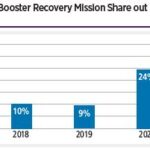
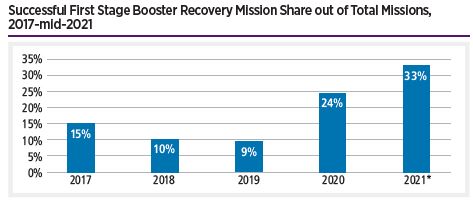 This fully interactive chart shows changes made in the accompanying table. Use the tools just above the table for sorting, advanced filtering, and other options, which will then be reflected…
 Orbital Launch Attempts by Share by Sector, 2017-mid-2021
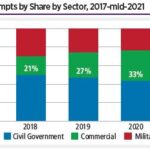
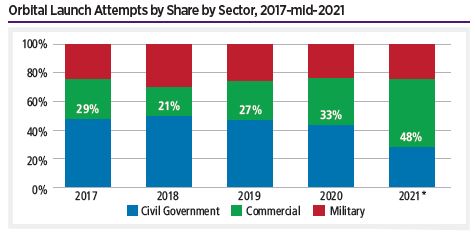 This fully interactive chart shows changes made in the accompanying table. Use the tools just above the table for sorting, advanced filtering, and other options, which will then be reflected…
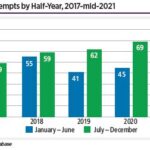
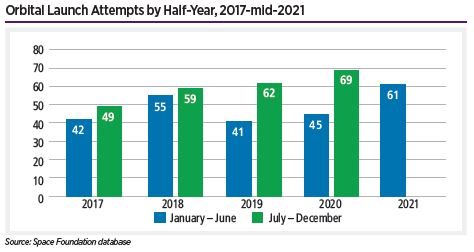
 Orbital Launch Attempts by Half-Year, 2017-mid-2021
 This fully interactive chart shows changes made in the accompanying table. Use the tools just above the table for sorting, advanced filtering, and other options, which will then be reflected…
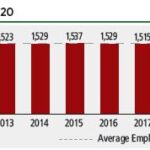
 Indian Department of Space Employment, 2011-2020
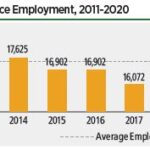
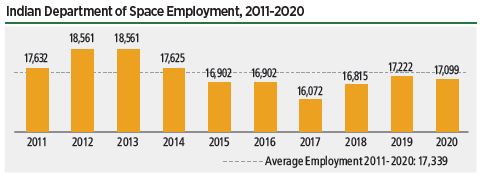
A large proportion of the workforce — 76% — is made up of technical employees. In 2020, women made up 19.5% of the space workforce and 16.1% of the technical workforce.
JAXA Workforce, 2010-2020
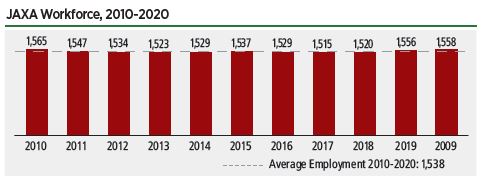
The Japan Aerospace Exploration Agency (JAXA) employed 1,558 people in 2020, approximately the same number as in 2019. Engineers and researchers account for 70.1% of this total.
European Space Industry Employment, 2010-2020
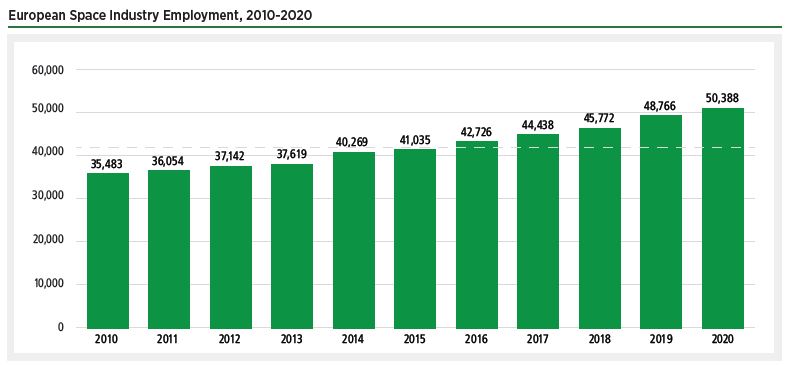
The European space workforce included 50,388 workers in 2020, an increase of 3.3% from the 48,766 workers in 2019. The largest increases were seen in . . .
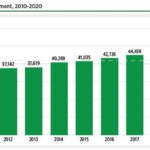
Japanese Space Industry Employment, 2009-2019
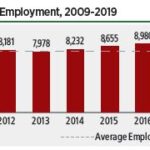
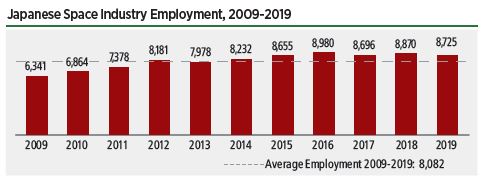
According to the Society of Japanese Aerospace Companies, the Japanese space workforce included 8,725 workers in 2019. . . More than 70% of these workers are in the space vehicle sector. While this sector decreased 1.9% from 2018 to 2019, it remains nearly 10% larger than it was five years ago.
Index Weight by Listing Country as of June 30, 2021

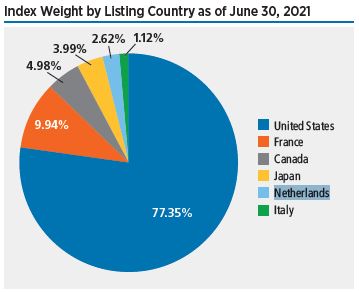
At the end of Q2, U.S.-listed companies comprised 77.35% of the weight of the overall index, with France in second place at 9.94%, followed by Canada at 4.98%, Japan at 3.99%, the Netherlands at 2.62%, and Italy at 1.12%. Israel is not formally included because Gilat (4.5% of the index weight) is listed on Israeli and U.S. exchanges, and the U.S. listing is used for the index due to higher trading activity.