Interactive Tables and Charts
Data Investment
Virgin Galactic Stock Performance, Q3 2021
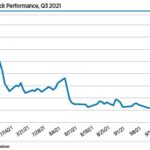
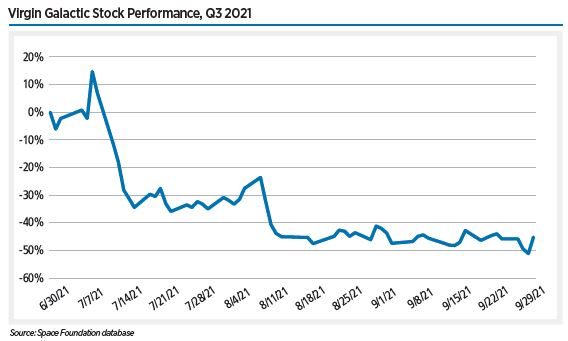
Virgin Galactic (-45%) had been trending upward in Q2 in anticipation of founder Richard Branson’s suborbital spaceflight as part of the first passenger flight by the company, which occurred near the beginning of Q3 on July 11. The momentary stock price peak following the successful flight, and its accompanying media fanfare, quickly disappeared as the company announced the issuance of $500 million in additional shares the following day.
Index Weight by Listing Country as of June 30, 2021
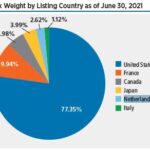
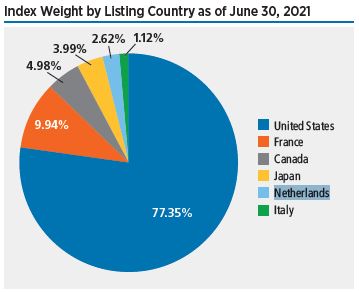
At the end of Q2, U.S.-listed companies comprised 77.35% of the weight of the overall index, with France in second place at 9.94%, followed by Canada at 4.98%, Japan at 3.99%, the Netherlands at 2.62%, and Italy at 1.12%. Israel is not formally included because Gilat (4.5% of the index weight) is listed on Israeli and U.S. exchanges, and the U.S. listing is used for the index due to higher trading activity.
S-Network Space Index vs. Benchmark Indexes, Q2 2021
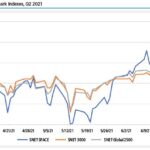
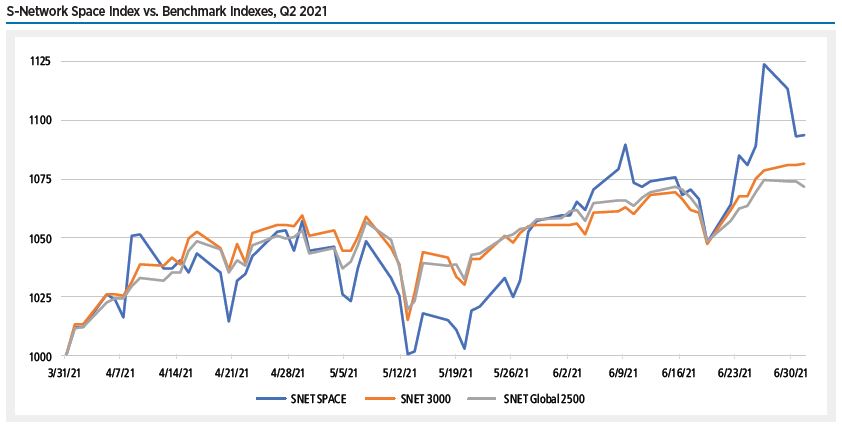
In the second quarter of 2021, the S-Network Space Index (SNET SPACE) outperformed other benchmark indexes, gaining 9.4%. This compares to an 8.2% increase for the S-Network U.S. Equity 3000 Index (SNET 3000), which tracks the 3,000 largest (by market capitalization) U.S. stocks.
S-Network Space Index Weight by Country as of March19, 2021
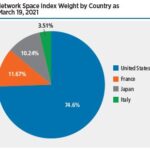
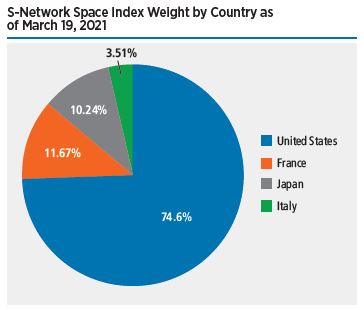
On March19, 2021, the index underwent its quarterly rebalancing to maintain compliance with the index rules—adjusting the relative contributions of each of the constituent companies. In contrast with early 2020, which saw multiple out-of-cycle changes due to company bankruptcies, there were no changes to the constituents, and the index continued to track 31 companies.
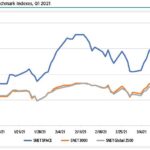
S-Network Space Index vs. Benchmark Indexes, May 7, 2018 –March 31, 2021
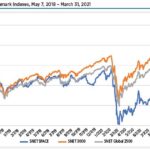
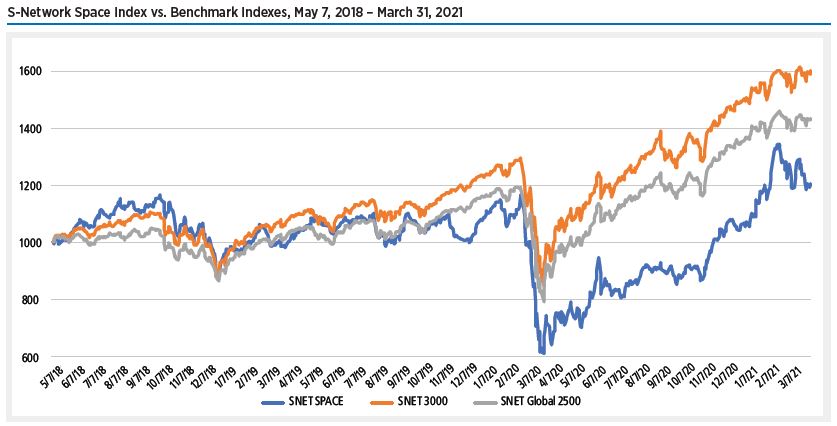
Assessing the multi-year performance of the S-Network Space Index since live calculation began in May 2018, the outperformance in Q1 2021 was insufficient to close the substantial gap the SNET 3000 and SNET Global 2500 opened up in late 2019 and early 2020.
S-Network Space Index vs. Benchmark Indexes, Recovery from COVID-19 Crash
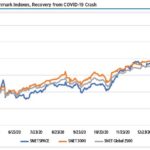
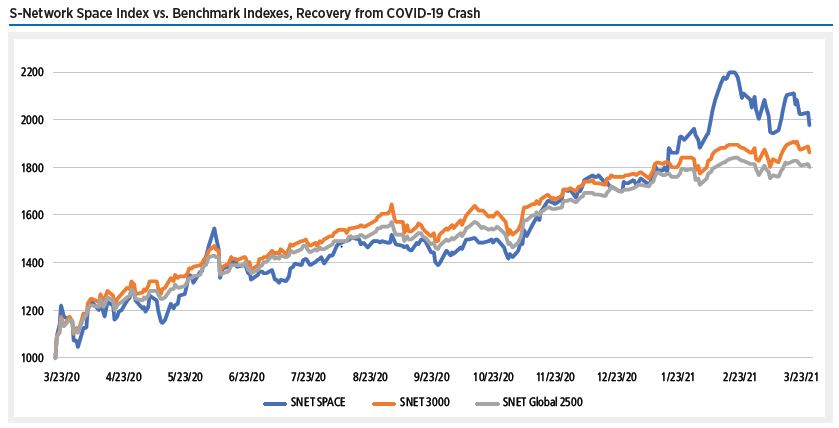
The first quarter of 2021 also marked the one-year anniversary of the COVID-19 market crash, which brought all three indexes to their lowest point on March 23, 2020. The indexes regained value essentially at the same rate until mid-January 2021, when SNET SPACE pulled away from its peers.
S-Network Space Index vs. Benchmark Indexes Q1 2021
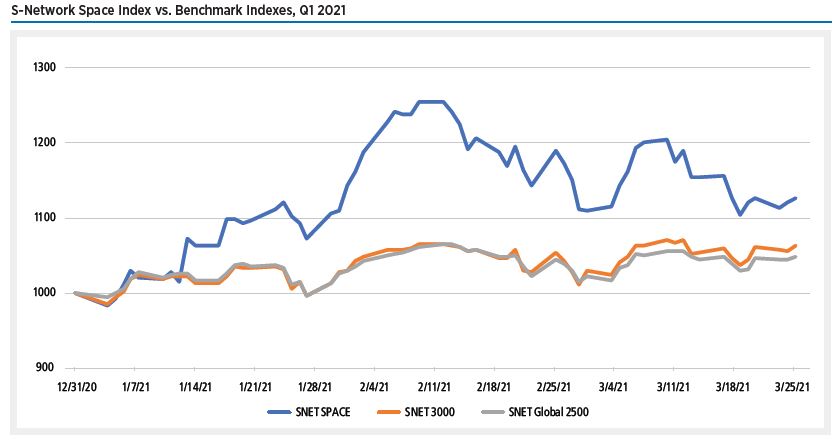
In the first quarter of 2021, the S-Network Space Index (SNET SPACE) grew more than twice as much as other benchmark indexes, gaining 12.7% as shown in the index chart. This compares to a 6.3% increase for the S-Network U.S. Equity 3000 Index (SNET 3000), which tracks the 3,000 largest (by market capitalization) U.S. stocks.
- « Previous
- 1
- 2