Interactive Tables and Charts
Data Infrastructure
Launch Log, 2016

Interested in global space launch vehicle satellite activity? Please select the associated link to read about it. Launch data is updated every day during weekdays, excluding U.S. holidays.
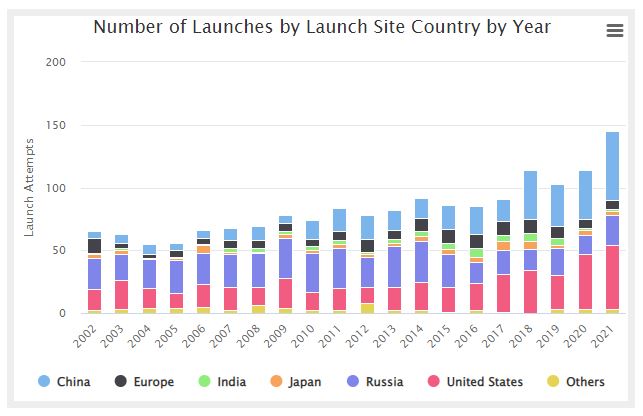
Number of Launches by Launch Site Country per Year
Mass Launched by Intended Orbit
… Thank you for visiting The Space Report! The Authoritative Guide to Global Space Activity, Packed with Over a Decade of Data, Resources, and Information. VIEW SUBSCRIPTION PLANS Username Password Remember Me Forgot Password
Global Space Activity
… Thank you for visiting The Space Report! The Authoritative Guide to Global Space Activity, Packed with Over a Decade of Data, Resources, and Information. VIEW SUBSCRIPTION PLANS
Launch Log, 2015
Interested in global space launch vehicle satellite activity? Please select the associated link to read about it. Launch data is updated every day during weekdays, excluding U.S. holidays.
Launch Log, 2014
Interested in global space launch vehicle satellite activity? Please select the associated link to read about it. Launch data is updated every day during weekdays, excluding U.S. holidays.
Launch Log, 2013
Interested in global space launch vehicle satellite activity? Please select the associated link to read about it. Launch data is updated every day during weekdays, excluding U.S. holidays.
Launch Log, 2012
Interested in global space launch vehicle satellite activity? Please select the associated link to read about it. Launch data is updated every day during weekdays, excluding U.S. holidays.
Launch Log, 2011
Interested in global space launch vehicle satellite activity? Please select the associated link to read about it. Launch data is updated every day during weekdays, excluding U.S. holidays.
Launch Log, 2010
Interested in global space launch vehicle satellite activity? Please select the associated link to read about it. Launch data is updated every day during weekdays, excluding U.S. holidays.