2012
2012 – United States Government Space Budget Overview
The United States was responsible for ##% of global government space spending in 2012. During FY 2012, which ran from October 1, 2011 to September 30, 2012, U.S. government agency space budgets totaled $## billion, a ##% increase from 2011. Defense-related space activities, comprising the U.S. Department of Defense (DoD), the National Reconnaissance Office (NRO), and the National Geospatial-Intelligence Agency (NGA), totaled $## billion, or ##% of U.S. government space spending. The remaining ##% comprised space-related spending by NASA, the Department of Energy (DOE), the Federal Aviation Administration (FAA), the Federal Communications Commission (FCC), the Department of the Interior (DOI), the National Oceanic and Atmospheric Administration (NOAA), and the National Science Foundation (NSF), which collectively budgeted $## billion for space activities.
2012 – Government Space Budgets Overview
Government space programs accounted for approximately $## billion in spending during 2012, representing ##% of the global space economy. Government investment in space grew by ##% in 2012, a rate lower than the average annual ##% growth rate between 2008 and 2012. The top-line figures, however, do not fully depict how some countries have significantly increased space spending while others have made cuts, as shown in Exhibit 2o below. Governments do not all operate under the same fiscal cycle, so international space spending numbers were derived…
2012 – Demographics
Considering the number of doctoral degrees earned in science and engineering, the European Union has the greatest proportion, followed by China and the United States. As with first university degrees, China has been rapidly increasing the number of doctoral science and engineering degrees granted since the early 2000s.
2012 – Demographics
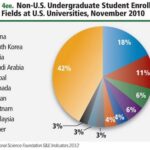
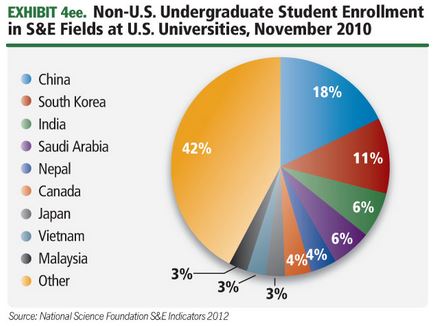
Universities in the United States attract a large number of foreign students. The largest proportion of these students comes from China, followed by South Korea and India. Retaining these highly trained graduates is important, particularly at a time when global competition for this talent is increasing. . .
2012 – Degrees Awarded
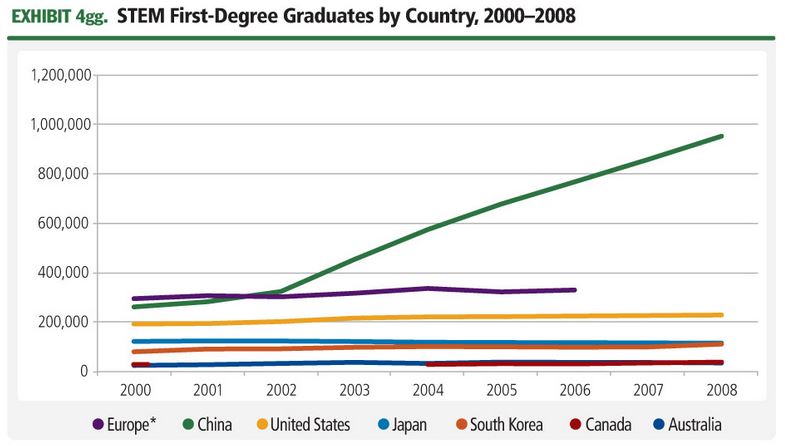
To understand the size of the pool of qualified students available for the future space workforce, it is important to know how many science, engineering, and aerospace degrees are being awarded.
2012 – NAEP
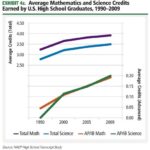
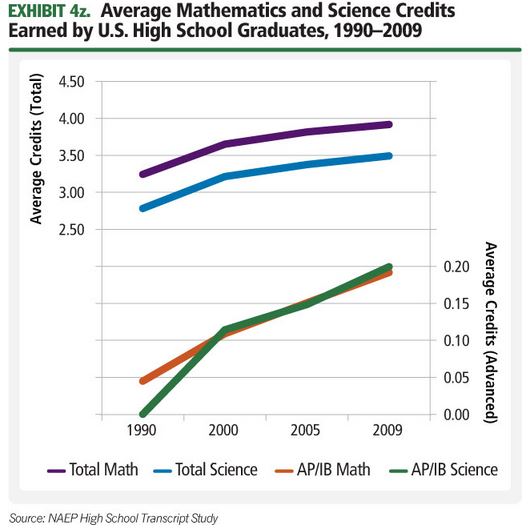
The production of highly skilled scientists and engineers has its foundation in student performance during early education at the primary and secondary levels. Long-term trends in these areas show that students’ mathematics performance in the United States has been slowly improving over the past three decades.
2012 – Top-level Trends
Science and engineering education provides the advanced skills required for a competitive space workforce. It also cultivates the expertise needed for research and innovation. Understanding trends in the production of highly skilled scientists and engineers can provide an indication of long-term prospects for the space workforce.
2012 – Other Space Employment
There are more than 50 countries with space programs in all regions of the world. Although it is not possible to get detailed statistics on many of these groups from year to year, it is possible to gather estimates that give some indication of overall size. Exhibit 4w provides estimates of the size of the space workforce in a variety of national space agencies.
2012 – Japan Aerospace Exploration Agency Employment
The Japan Aerospace Exploration Agency (JAXA) workforce has decreased steadily over the past decade, from more than ## employees in 2003 to ## in 2012, a decrease of more than ##%. Nearly ##% of JAXA’s workforce is made up of engineers and researchers, with the remainder categorized as administrative or educational personnel.
2012 – Japanese Space Industry Employment
Japan’s space workforce included ## workers in 2011, reaching the highest level in the past 10 years. The workforce in Japan grew by ##% from 2010 to 2011, adding ## workers. Japanese space employment has grown ##% in just three years, from its low point in 2008, and is currently ##% above the 10-year average.