Appendix
EO-RS Payload Shares, 2022
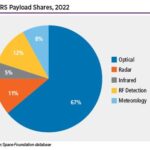
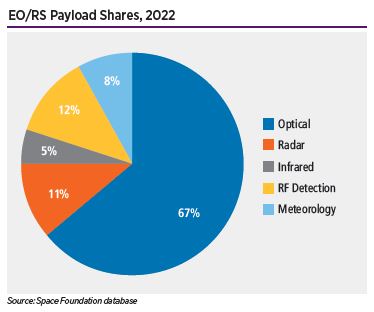
Satellites deployed with EO/RS payloads in 2022 (265) exceeded EO/RS satellite deployments in 2021 (191). More than half of the EO/RS payloads (149) involved optical imagery collection system. Other EO/RS satellites hosted payloads that detect radio waves emanating from the Earth. Satellites with synthetic aperture radar (SAR) payloads made up about 11% (24) of EO/RS satellite deployments in 2022,
Spacecraft Mission Segment Shares by Nation, 2022
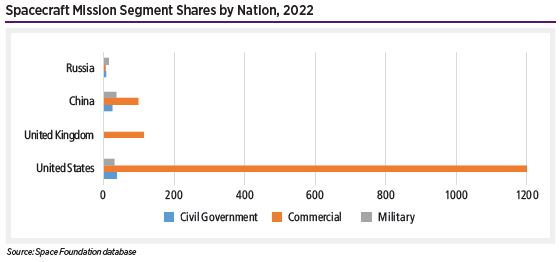
Compared with 2021’s 90% commercial spacecraft deployment share, 2022’s increased to 91%, even as spacecraft deployed in 2022 grew by 36% over the previous year. Spacecraft with civil government mission payloads accounted for 107 (4.5%) of all spacecraft deployed in 2022, slightly higher than 2021’s 99 civil government spacecraft deployments. Military missions comprised the remaining 3.5% (80) of the world’s deployed spacecraft in 2022, higher than the 69 military spacecraft deployments in 2021.
Estimated U.S. Department of Defense Space Spending, 2005-2022
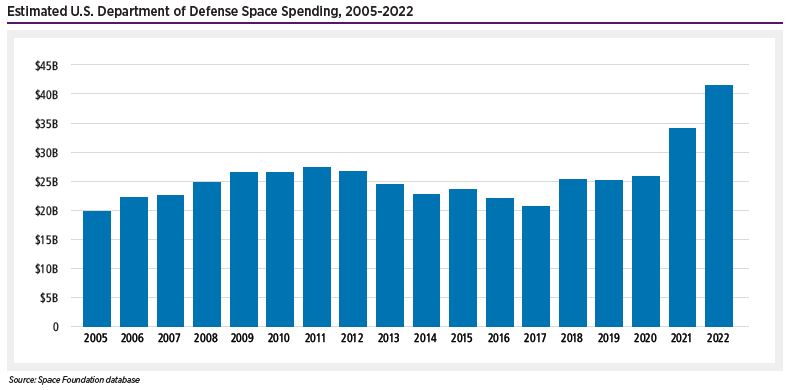
This developing space strategy is reflected in growing military space spending by the United States, with the Pentagon more than doubling space budgets from $19.7 billion in 2005 to an estimated $41.4 billion in 2022.
Index Weight by Listing Country as of Dec. 16, 2022
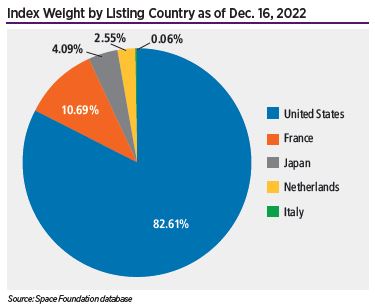
As of December, U.S.-listed companies comprised 82.61% of the weight of the overall index, with France in second place at 10.69%, Japan at 4.09%, the Netherlands at 2.55%, and Italy at 0.06%. Canada was no longer represented due to the removal of MDA, and Italy’s share dropped by a factor of 10 due to the removal of Avio.
S-Network Space Index vs. Benchmark Indexes, 2022
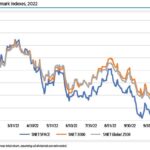
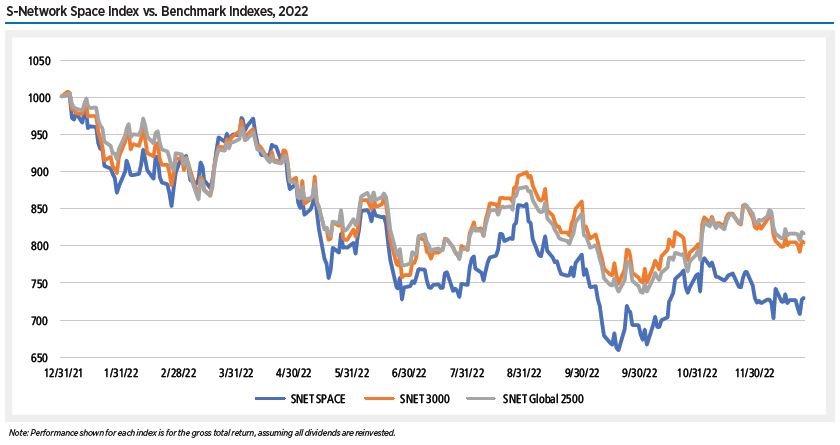
Assessing the performance of the S-Network Space Index for the entirety of 2022, poor performance during the first half of the year resulted in overall losses of 26.8%. This compares with annual declines of 19.5% for the SNET 3000 and 18.3% for the SNET Global 2500, which had a slightly better first half of the year.
S-Network Space Index vs. Benchmark Indexes, H2 2022
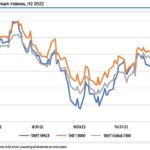
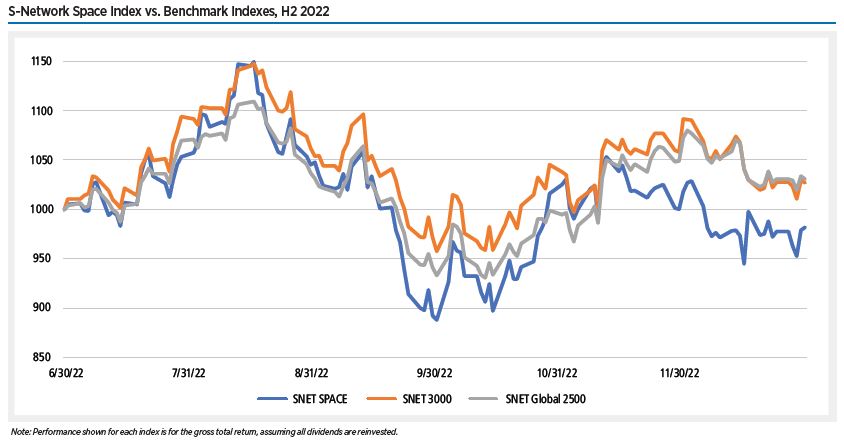
In the second half of 2022, the S-Network Space Index (SNET SPACE) underperformed other benchmark indexes, declining 1.7%. This compares to a 0.3% increase for the S-Network U.S.
Lunar Missions by Type
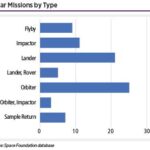
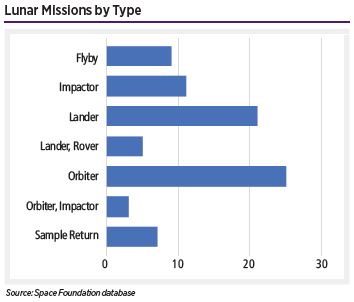
Historically, orbiters have been the most common lunar mission type (35%). Planned lunar space stations such as Gateway could expand capabilities in lunar orbit. However, most planned missions over the next decade are for lunar landers.
Lunar Missions by Result, 1959-2022
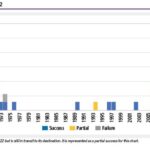
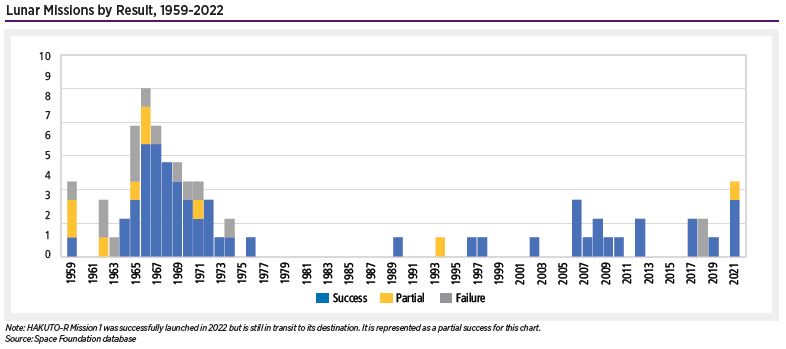
Eight nations have launched lunar missions, but only three have landed on the Moon. In 2022, four missions were partially or fully successful, a tempo last seen in 1969 — the year the first humans stepped foot on the lunar surface.
United Kingdom Space Budget, 2005-2021
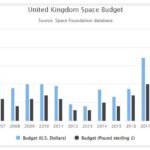
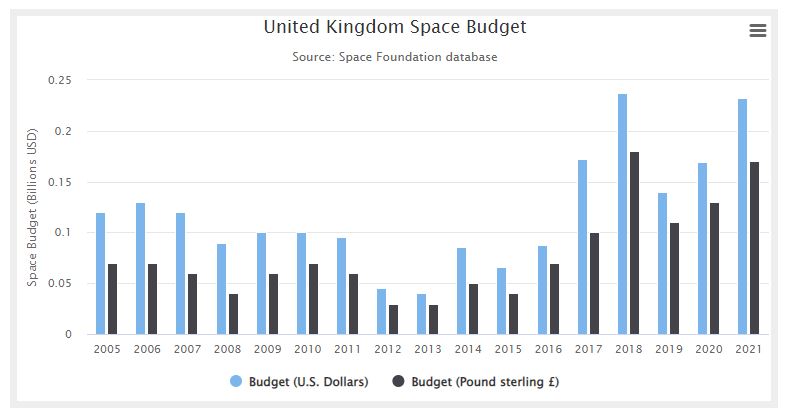
The United Kingdom Space Agency (UKSA) is an executive agency of the Government of the United Kingdom, responsible for the United Kingdom’s civil space program.
South Korean Space Budget, 2005-2021
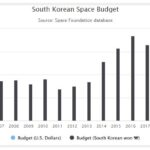
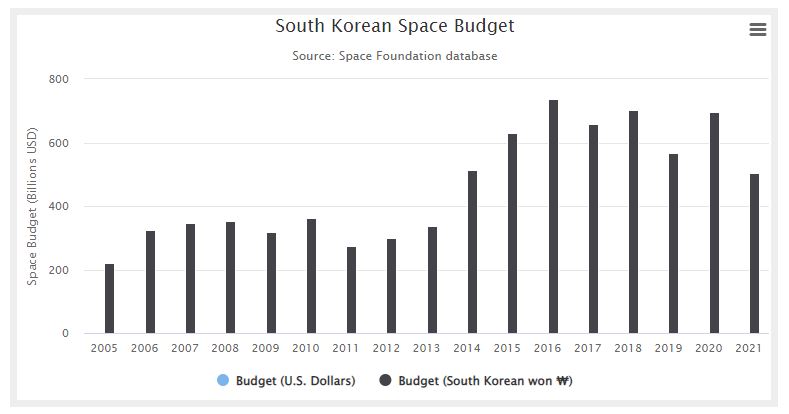
The South Korean government continued development of a Korean-made launch vehicle and improvement in the country’s ability to utilize information gathered by satellites.